はじめに
この記事では、ipywidgetsのIntSliderを使用して、Matplotlibの3Dプロットのアスペクト比をインタラクティブに調整する方法について解説します。set_box_aspect関数の活用方法と実装例を紹介し、よりダイナミックな3Dデータ可視化を実現します。
コード
解説
モジュールのインポートなど
jupyter labでipywidgetsを表示するために%matplotlib widgetとします。
バージョン
データの生成
媒介変数で球面のデータを作成します。
surface plotによる球の表示
plot_surfaceでx,y,zのデータを3Dグラフ上にsurface plotとして表示します。
IntSliderの設定
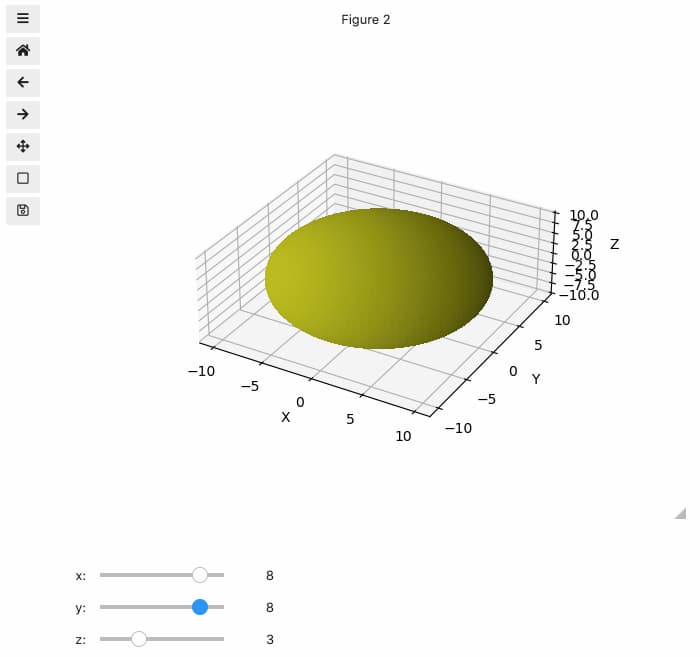
x_a、y_a、z_aの値を1から10の範囲でインタラクティブに変更できるようにします。
IntSliderを変化させたときの動作
set_box_aspect関数を使ってアスペクト比を設定できます。なお、デフォルト値は4:4:3で、この関数はMatplotlib version 3.3以上で利用可能です。
widgetの表示
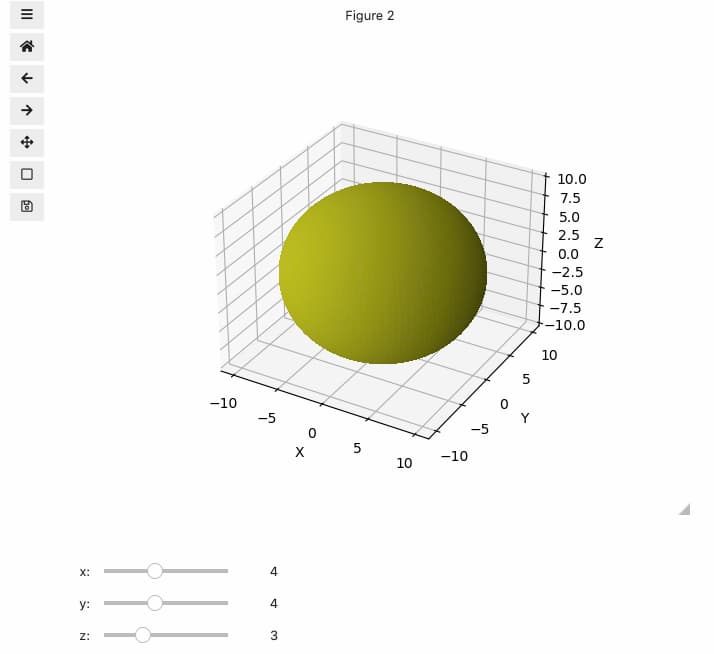
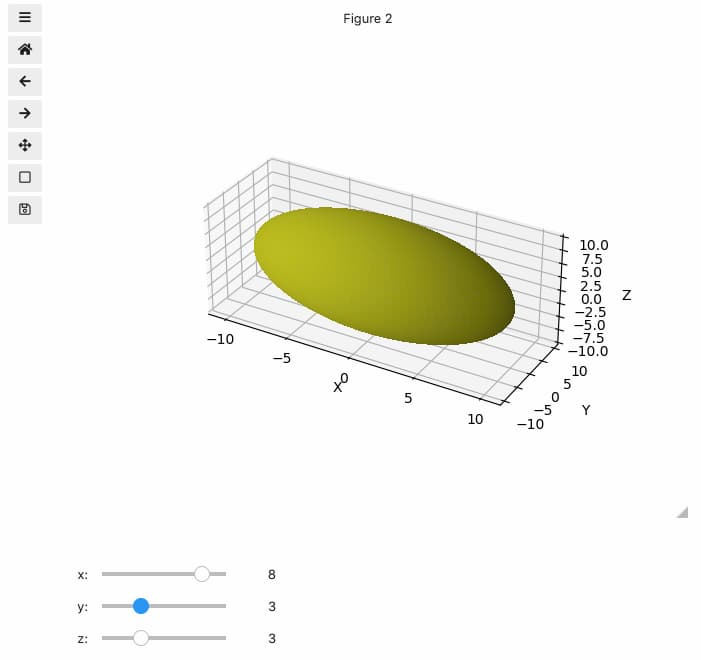
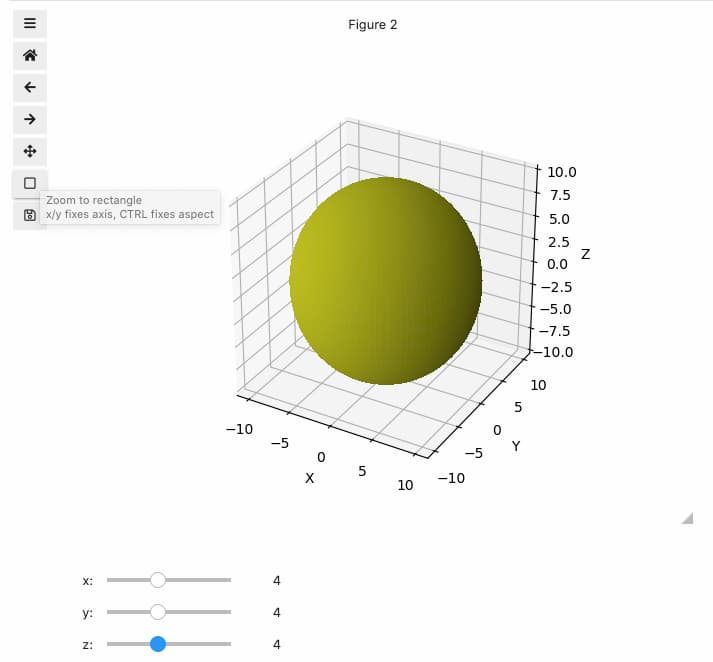
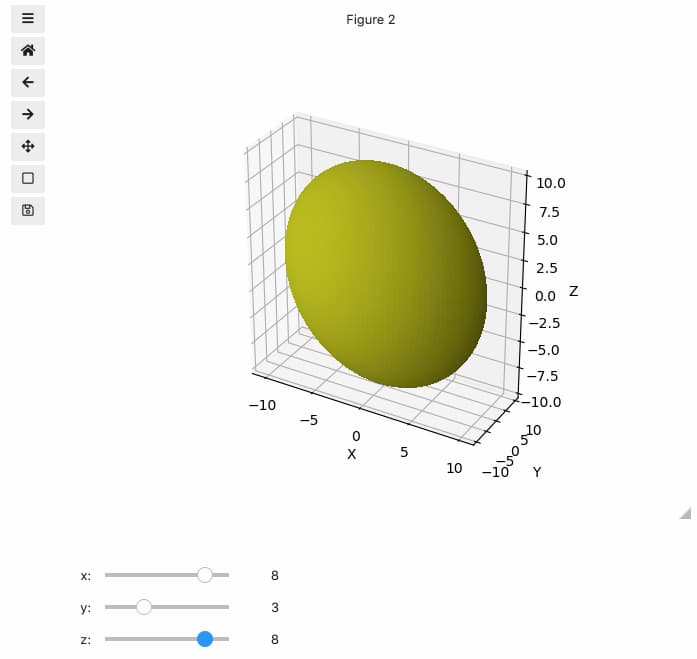
IntSliderを変化させたときの3Dプロットの変化
4:4:4の場合
8:3:8の場合
8:8:3の場合
まとめ
ipywidgetsのIntSliderとMatplotlibのset_box_aspect関数を組み合わせることで、3Dプロットのアスペクト比を簡単に調整できるようになります。これにより、データの視覚的な把握が容易になり、プレゼンテーションの質も向上します。ぜひ実際に試してみてください。
参考


What's new? — Matplotlib 3.3.0 documentation
matplotlib.org

mpl_toolkits.mplot3d.axes3d.Axes3D — Matplotlib 3.3.0 documentation
matplotlib.org
コメント