はじめに
matplotlibを使用すると、グラフ上に様々な注釈(テキストや矢印など)を追加することができます。これらの要素は、データの特定の特徴や重要なポイントを強調するのに役立ちます。
text()メソッドの主なパラメータ:
- x, y: テキストの位置(データ座標系)
- s: 表示するテキスト
- fontsize: フォントサイズ
- color: テキストの色
- alpha: 透明度(0〜1)
- rotation: テキストの回転角度(度数法)
- ha: 水平位置合わせ(’left’, ‘center’, ‘right’)
- va: 垂直位置合わせ(’top’, ‘center’, ‘bottom’)
コード&解説
モジュールのインポート
バージョン
グラフの上にテキストを配置
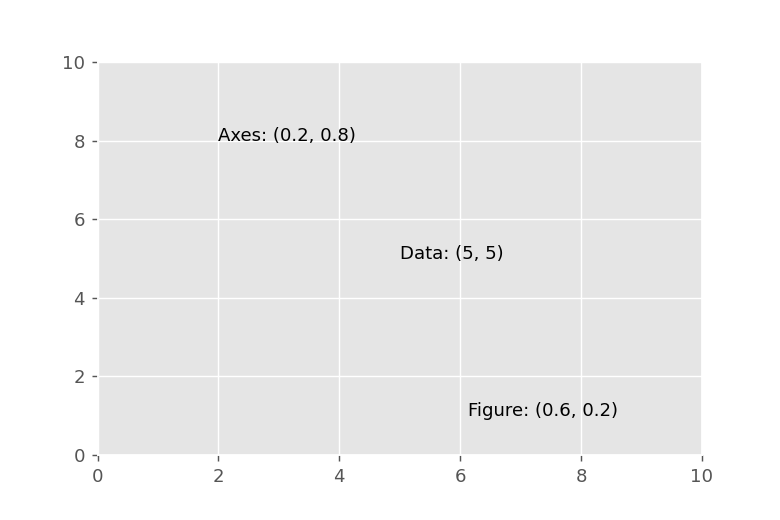
テキストを配置するには、ax.text()メソッドを使用します。テキストの表示位置は、transformパラメータで基準を定めます。 transform=ax.transDataの場合、図のx軸、y軸の目盛りに従ってテキストの配置位置が決まります。 transform=fig.transFigureの場合、figオブジェクト全体の左下を(0,0)、右上を(1,1)とする相対的な位置でテキストが配置されます。 transform=ax.transAxesの場合は、グラフエリアの左下を(0,0)、右上を(1,1)とする相対的な位置でテキストが配置されます。
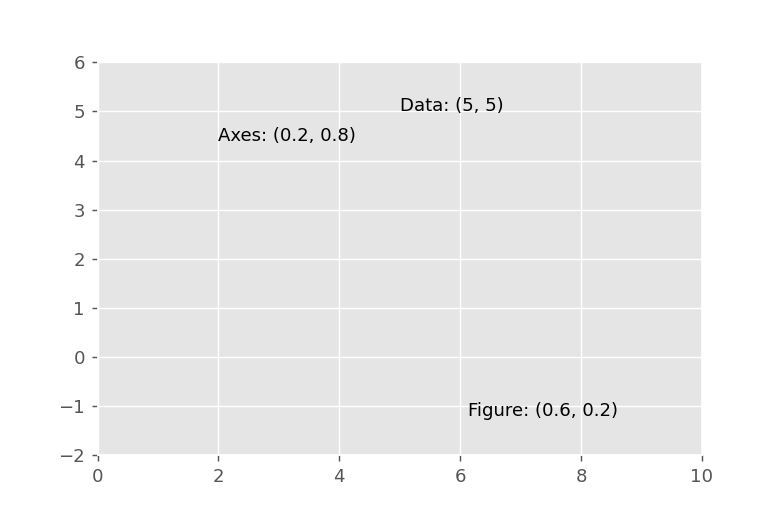
ylimで表示範囲を変更しても、transform=fig.transFigureやax.transAxesを使用した場合は、テキストの位置は変化しません。
annotateによる注釈の表示
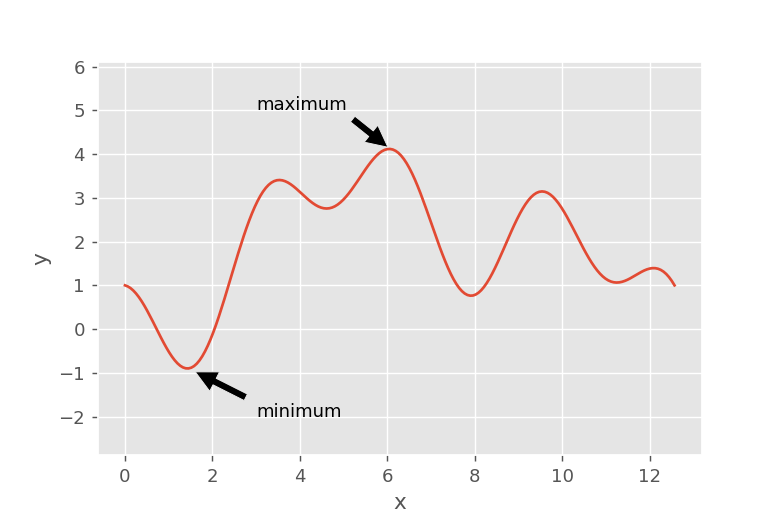
ax.annotate(‘maximum’, xy=(x[np.argmax(y)], np.max(y)), xytext=(3,5)…を使用すると矢印付きのテキストを表示できます。最初の引数にテキスト内容を指定し、xyパラメータには矢印の先端座標、xytextパラメータにはテキストの表示位置を指定します。
arrowpropsについて
arrowpropsパラメータを設定することで矢印の外観をカスタマイズできます。以下では、具体的な例とともにその設定オプションを詳しく説明します。
arrowpropsの主なオプション:
connectionstyle: 接続スタイル(”arc3″、”angle”、”angle3″など)
facecolor: 矢印の色
edgecolor: 矢印の輪郭の色
linewidth: 矢印の線の太さ
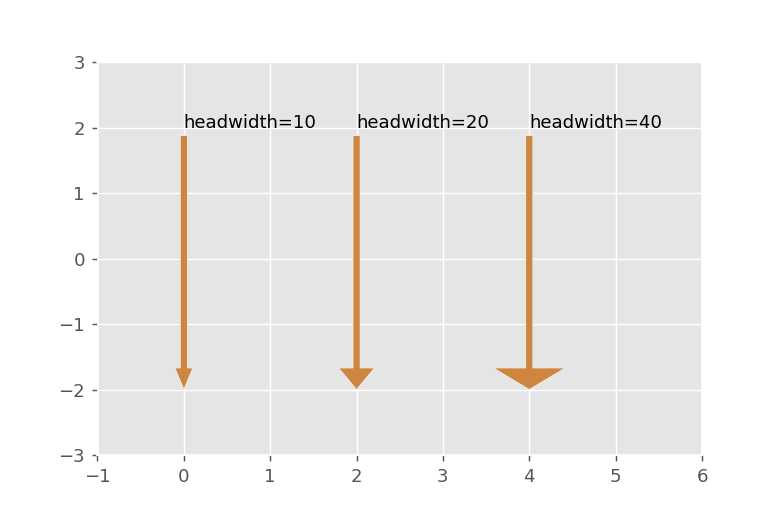
headwidth: 矢印の頭の幅
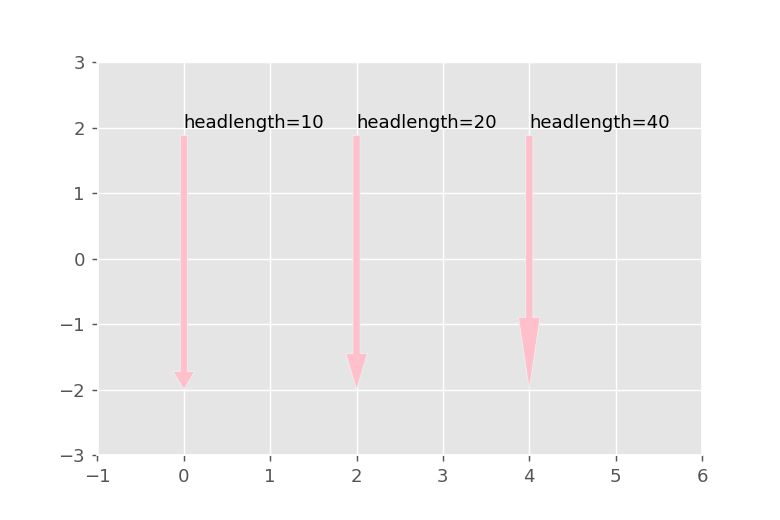
headlength: 矢印の頭の長さ
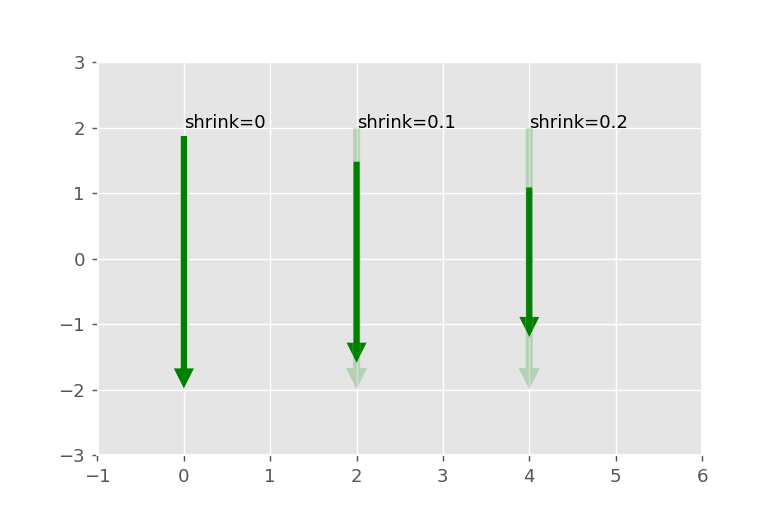
shrink: 矢印の短縮率(テキストと矢印先端からの距離)
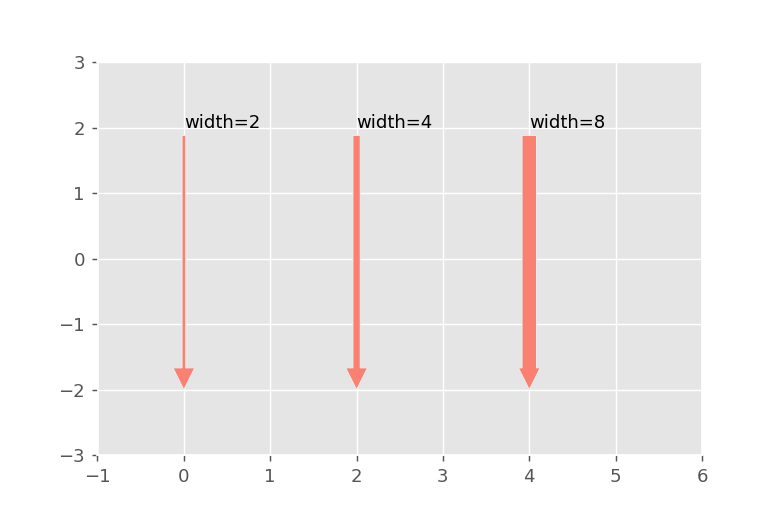
width: 矢印の幅
shrink
shrinkで矢印を縮ませることができます。
headlength
headlengthで矢印の先端の長さが変化します。
headwidth
headwidthで矢印の先端の幅が変化します。
width
widthで矢印の棒の太さを変えることができます。
まとめ
matplotlibのテキストと矢印機能を使うことで、グラフをより情報豊かで説明的にすることができます。これらの注釈は以下のような用途に特に役立ちます:
- 重要なデータポイントの強調
- トレンドや特徴の説明
- 異常値や特異点の指摘
- グラフの特定の部分に注目を集める
適切な注釈を追加することで、データの視覚化はより分かりやすく、説得力のあるものになります。
参考


コメント