はじめに
matplotlibのscatter関数を使って画像をドット(点)の集合として表示する方法について解説します。この手法は「スティップリング (Stippling)」と呼ばれる点描画の技法に似ており、通常のimshow関数による画像表示と異なる視覚効果を生み出すことができます。
コード&解説
モジュールのインポートなど
バージョン
画像の読み込み
skimageのネコ画像を読み込見ます。
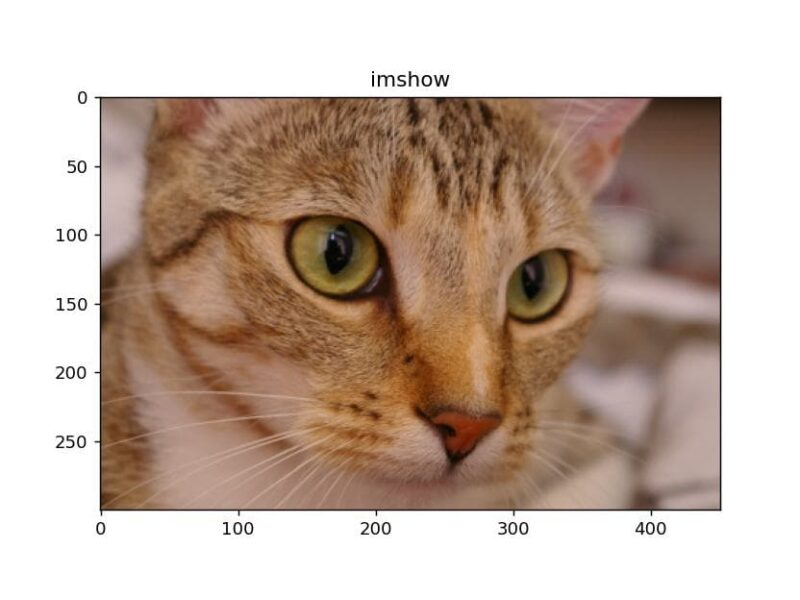
imshow()で表示
ネコ画像をimshowで表示すると以下のようになります。
散布図で表示する
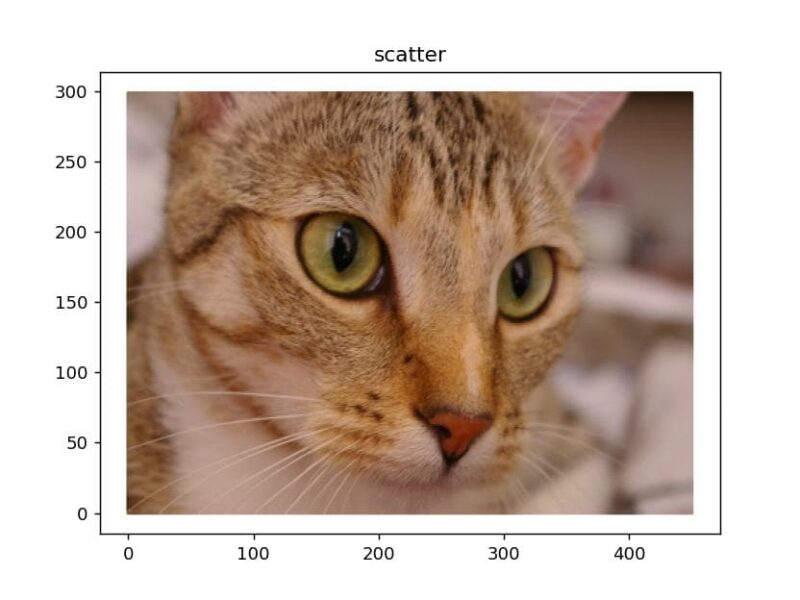
plt.scatter()関数を使用する場合、x,yの座標データが必要です。そのため、画像サイズを利用してnp.arange()とnp.meshgrid()関数で座標データを作成します。
scatter関数で画像を表示すると以下のような結果になります。c=パラメータにRGBデータを指定することで色情報を反映させています。これにより、imshow()関数と同様の画像表示効果が得られます。
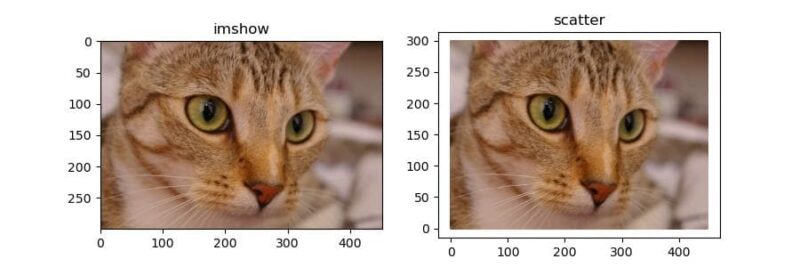
imshowとscatterを比較
横に並べて表示してもほぼ同じであることがわかります。
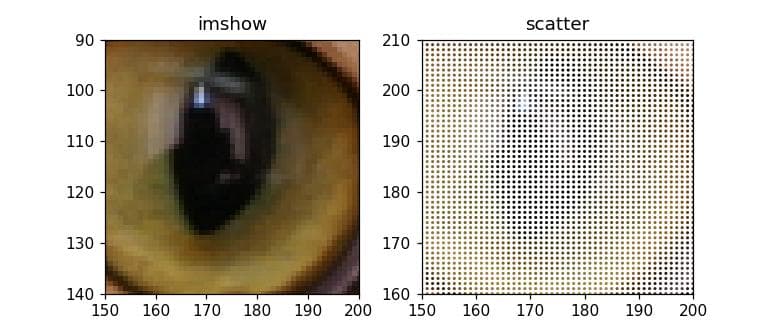
imshowとscatterを比較 拡大して表示
ほぼ同じ位置を拡大して表示すると散布図は点で構成されていることがわかります。
参考

matplotlib.pyplot.scatter — Matplotlib 3.10.8 documentation
matplotlib.org

コメント