
はじめに
この記事では、Pythonのmatplotlibライブラリを使用して画像を扱う方法について解説します。画像の読み込み、表示、操作、および保存方法など、matplotlibでの画像処理の基本を学ぶことができます。
コード & 解説
モジュールのインポート
画像の読み込み
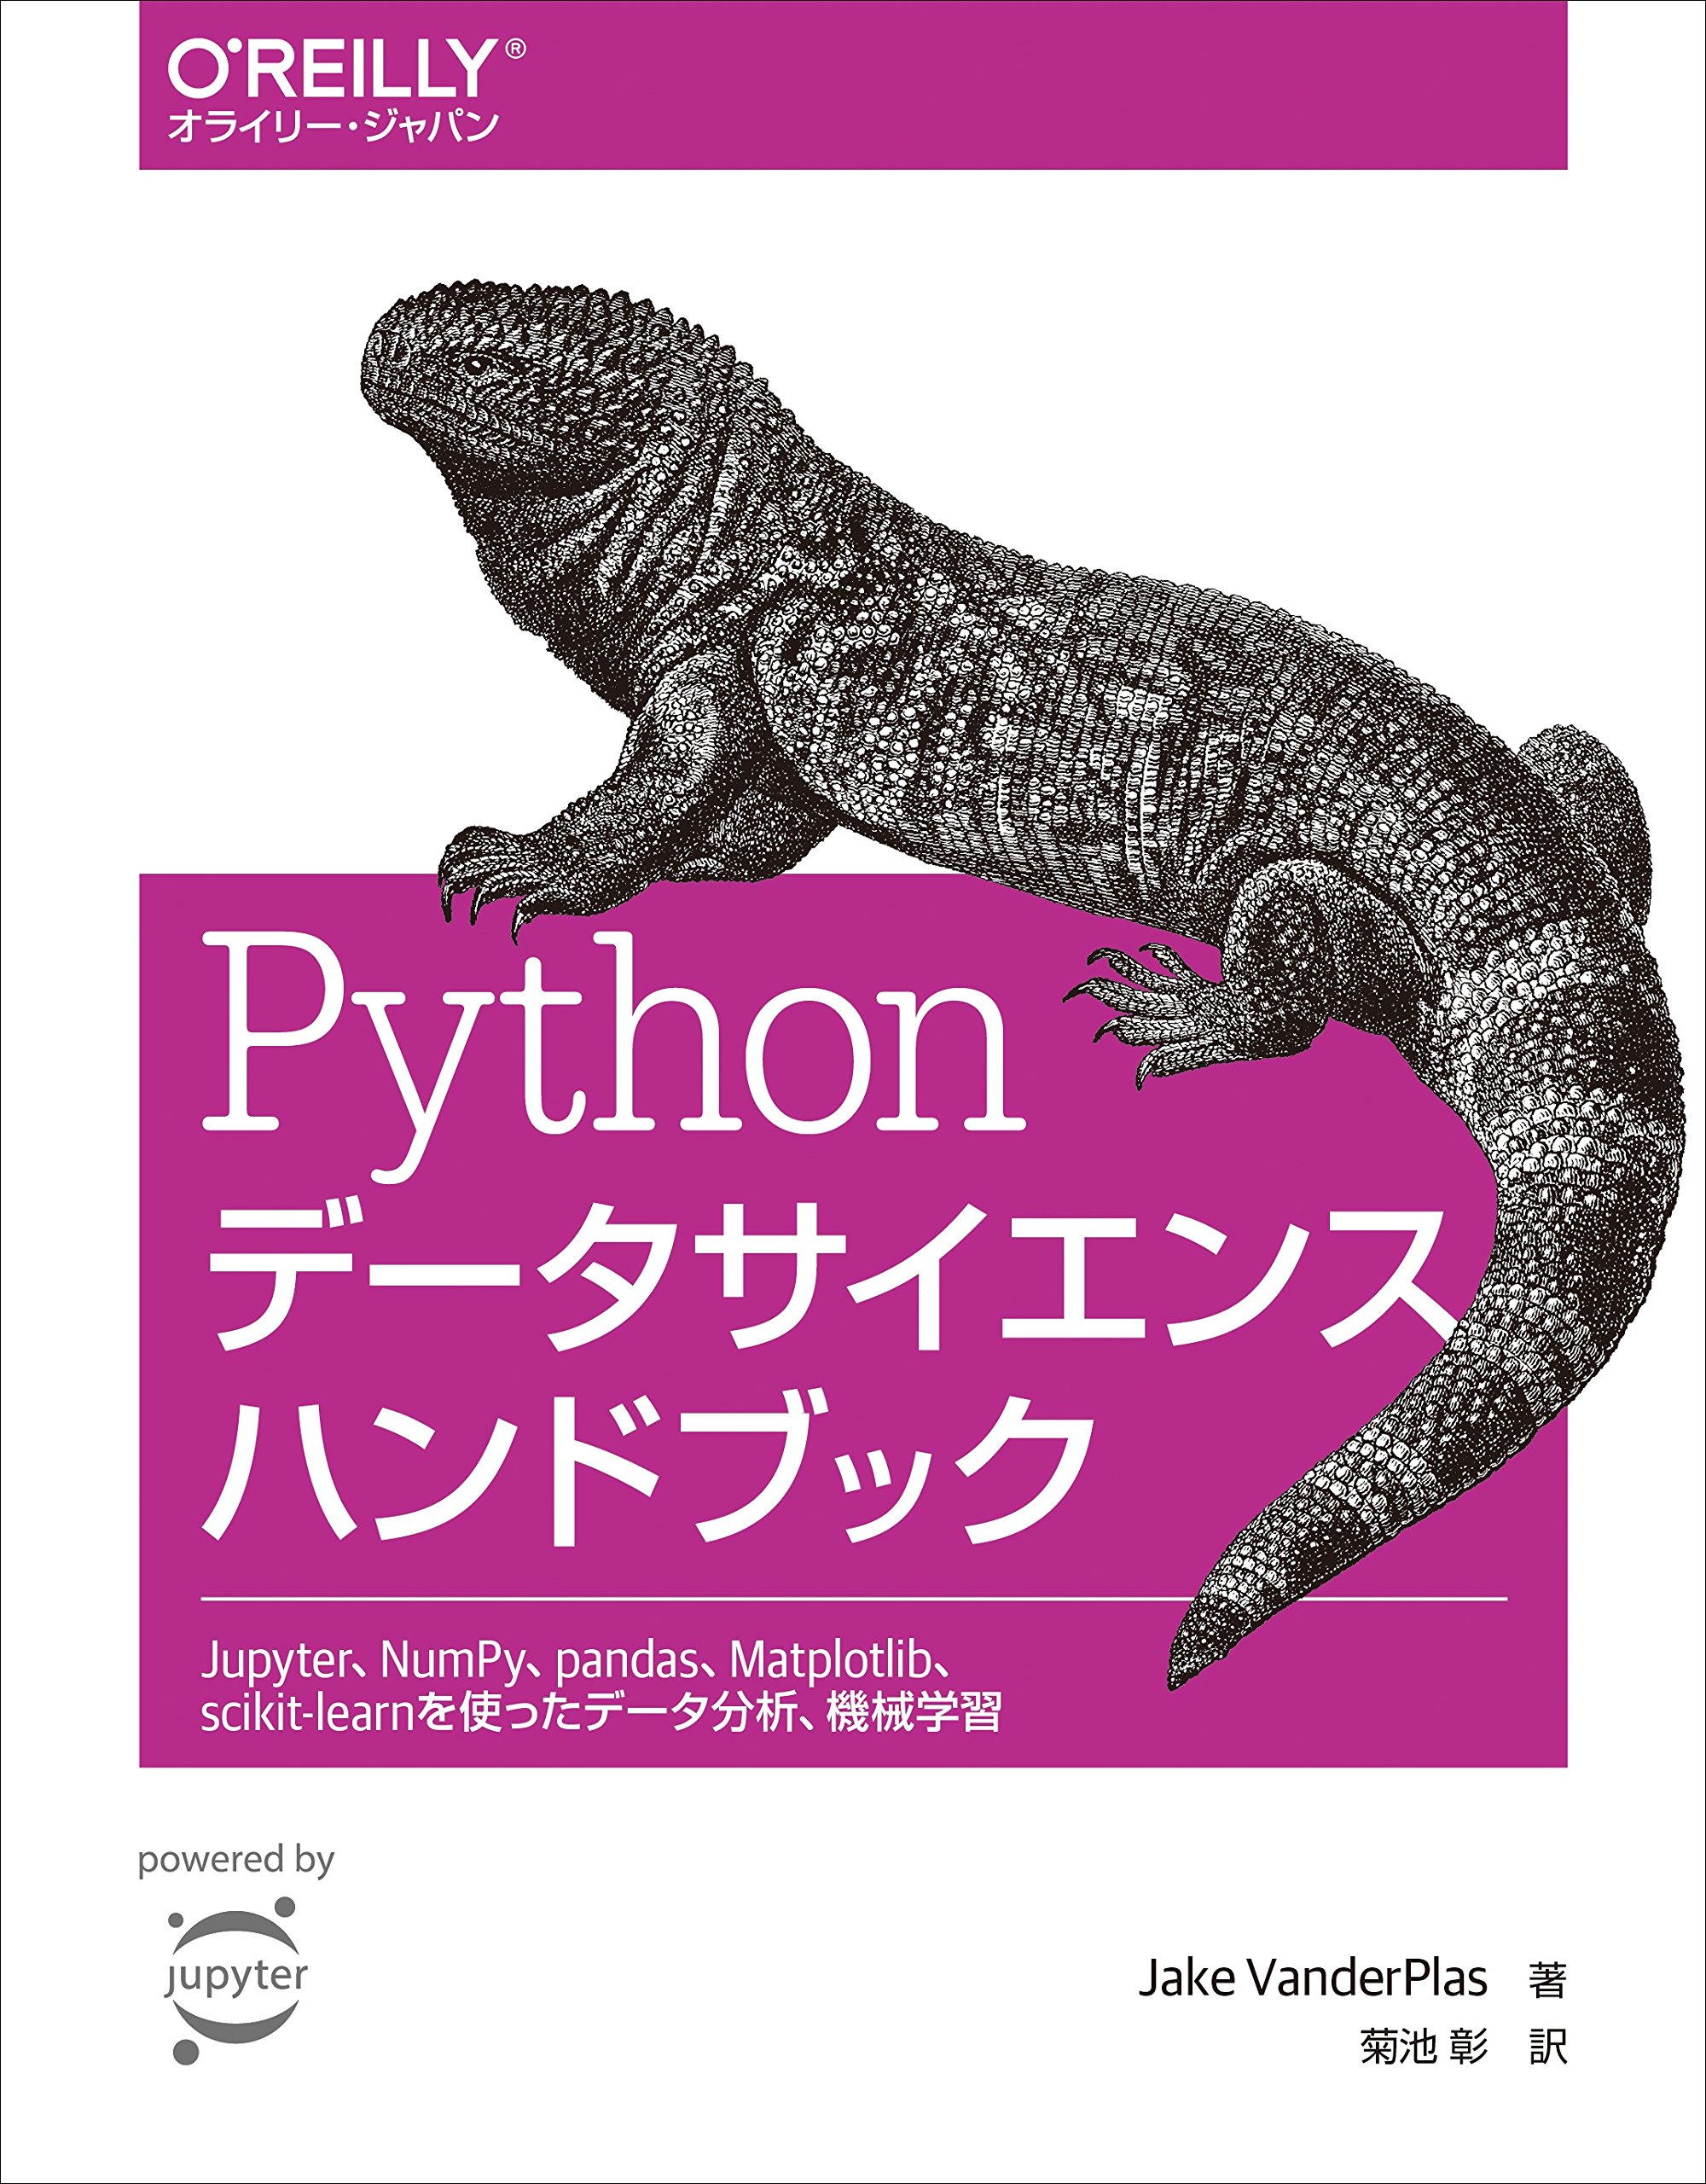
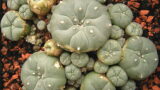
plt.imread(‘ファイル名’)を使用して、カレントディレクトリにある画像を読み込みます。この例では、以下の画像を使用します。
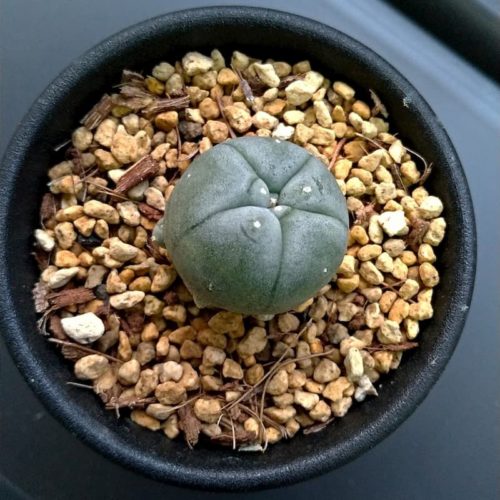
読み込んだ画像のサイズは、800×800のそれぞれの位置にRGBの色情報が格納されているため、(800,800,3)という形状になります。
画像の表示
plt.imshow(image)で画像が表示されます。
画像の保存
plt.imsave(‘ロフォフォラ.jpg’, image)のように、imsave(‘ファイル名’, 保存したい画像ファイル)と指定することで画像を保存できます。imsaveを使用した場合、画像のみが保存され、枠線や目盛りなどは含まれません。
疑似カラーマップによる表示
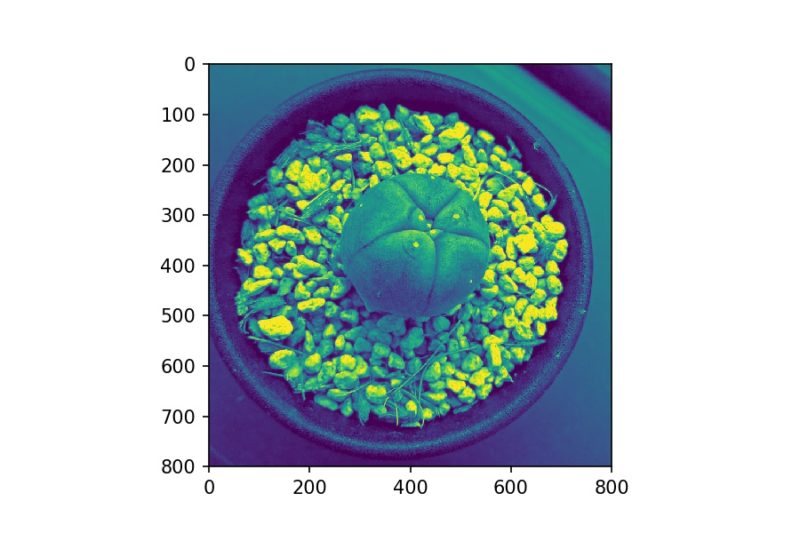
RGBのRのデータのみをimshowに渡すと、カラーマップによる表示となります。デフォルトのカラーマップはviridisであるため、以下のような表示になります。
グレースケールによる表示
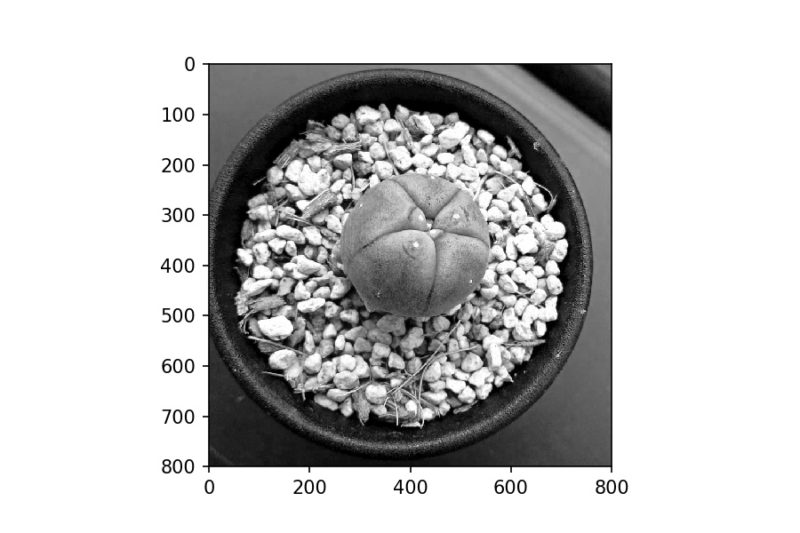
cmap=’Greys_r’とすることで、白黒画像となります。
カラーバーの表示
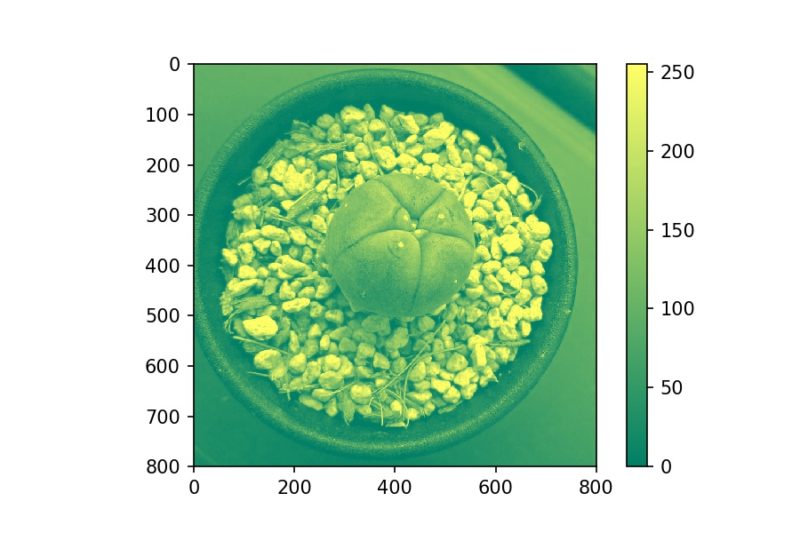
plt.colorbar()でカラーバーが表示されます。
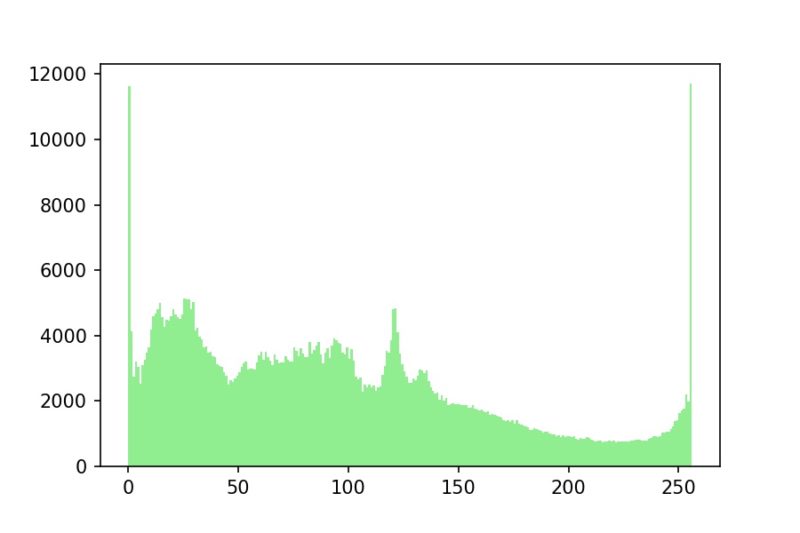
ヒストグラムの表示
plt.hist(img.ravel(), bins=256, range=(0.0, 256.0), fc=’lightgreen’)を使用すると、画像のヒストグラムを作成できます。
コントラストを高める
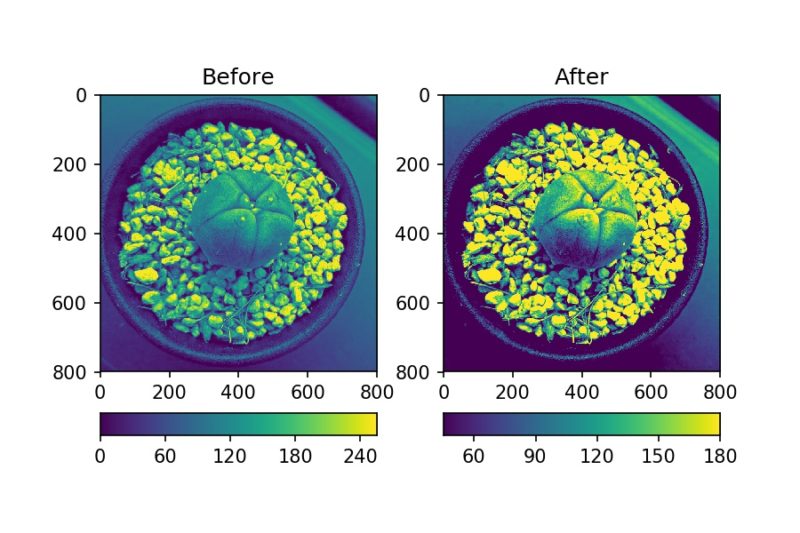
右の画像では、
im2 = grid[1].imshow(img, clim=(45, 180))というコードでヒストグラムの45から180の範囲にカラー設定を限定しているため、ハイコントラストな画像が得られています。
画像の補間
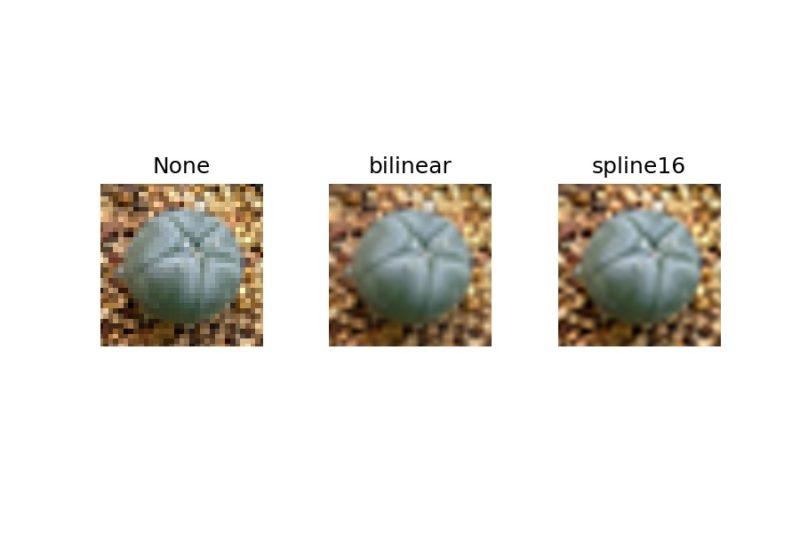
補間効果を明確に示すため、img.thumbnail((64, 64), Image.ANTIALIAS)を使用して画像を意図的に粗くしています。interpolation=”bilinear”のように補間方法を指定すると、滑らかに補間された画像が得られます。なお、補間方法は約15種類あります。

まとめ
matplotlibを使った画像処理の基本について解説しました。imshowメソッドを使った画像の表示方法、カラーマップの調整、画像データの操作と保存方法など、実用的な知識を紹介しました。これらの技術を応用することで、データ分析や科学計算における画像処理作業を効率的に行うことができます。
参考

コメント
[…] [matplotlibの使い方] 24. 画像 2019.03.182019.11.03 WindowsオフラインパソコンにcondaでPython環境構築 2019.06.072019.10.11 [SciPy] 1. Scipyのcurve_fitで最小2乗法近似、決定係数R2も求める […]
[…] [matplotlibの使い方] 24. 画像matplotlibでの画像の取扱方法sabopy.com2019.03.18 […]