はじめに
matplotlibのtriplot関数を使用してデータポイントのドロネー三角形分割を表示する方法について解説します。三角形分割はデータの空間的な関係を視覚化する強力な手法で、不規則に配置されたデータポイントから面を構成する際に役立ちます。
コード
解説
モジュールのインポート
データの生成
np.repeat(angles[…, np.newaxis], n_radii, axis=1)を使うと、anglesをn_radii回、列方向に繰り返した配列が得られ、形状は(18, 6)になります。
angles[:, 1::2] += np.pi / n_anglesは、1列目から一つおきに要素にnp.pi / n_anglesを加えます。
ドロネー三角形分割の生成
tri.Triangulation(x, y)を使用すると、データポイント(x, y)のドロネー三角形分割が生成されます。
ドロネー三角形分割のマスク処理
hypot関数は2乗和の平方根を返すため、np.hypot(x[triang.triangles].mean(axis=1), y[triang.triangles].mean(axis=1)) < min_radiusは、原点からの距離がmin_radiusより小さい部分でTrueとなります。これをマスクとして使用するため、Trueとなる部分では点と線が表示されないこととなります。
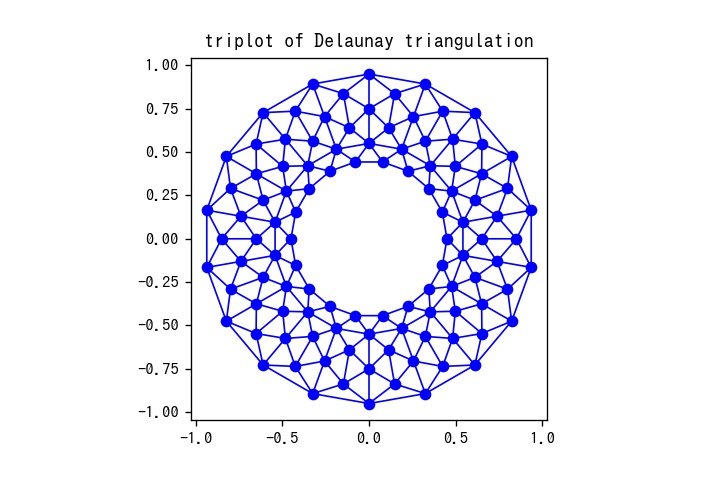
triplotでドロネー三角形分割を表示
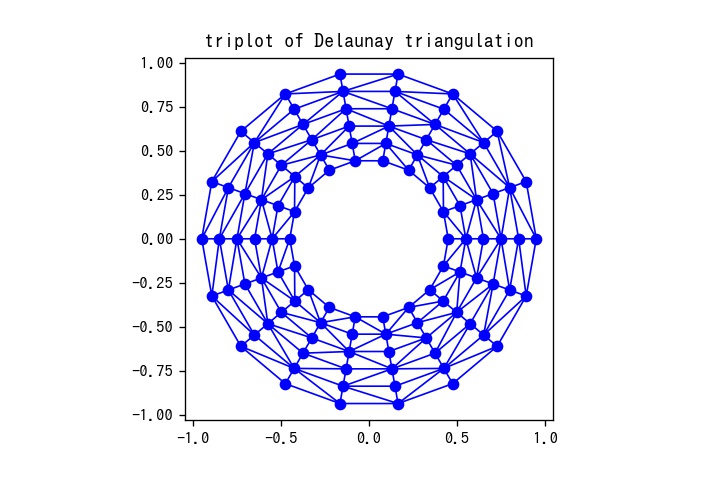
データの一部分を回転させなかったときの図
angles[:, 1::2] += np.pi / n_angles #swirl dataを実行しない場合、図は以下のように表示されます。
まとめ
matplotlibのtriplot関数を使うことで、不規則に配置されたデータポイントからドロネー三角形分割を簡単に可視化できることを学びました。この手法は空間データの関係性を理解するのに役立ち、補間や有限要素法などの応用にも活用できます。
参考

Triplot Demo — Matplotlib 3.1.2 documentation
matplotlib.org

matplotlib.pyplot.triplot — Matplotlib 3.1.2 documentation
matplotlib.org

numpy.hypot — NumPy v2.4 Manual
docs.scipy.org
コメント