
はじめに
この記事では、matplotlib を使って三次元の非構造データから塗りつぶし等高線(tricontourf)を作成する方法について説明します。非構造データとは、規則的な格子状ではないランダムな位置に配置されたデータポイントのことです。tricontourf 関数を使うことで、このような不規則なデータからでも美しい等高線図を描画することができます。
主なポイント:
- 等高線レベルの調整方法
- 非構造三次元データの視覚化手法
- tricontourf 関数の使い方と基本パラメータ
- カラーマップの選択とカスタマイズ
コード
解説
モジュールのインポート
バージョン
データの生成
np.random.uniform(-2, 2, npts)により-2以上,2未満のデータをnpts(200)個生成します。
3D Tricontourグラフの作成
重要なパラメータ
x, y, z: 非構造データの座標と値
levels: 等高線の数または具体的なレベル値のリスト
cmap: カラーマップ(viridis, jet, plasma, inferno, magmaなど)
alpha: 透明度(0.0〜1.0)
extend: ‘neither’, ‘both’, ‘min’, ‘max’のいずれかを指定し、最小値/最大値を超える領域の表示方法を設定
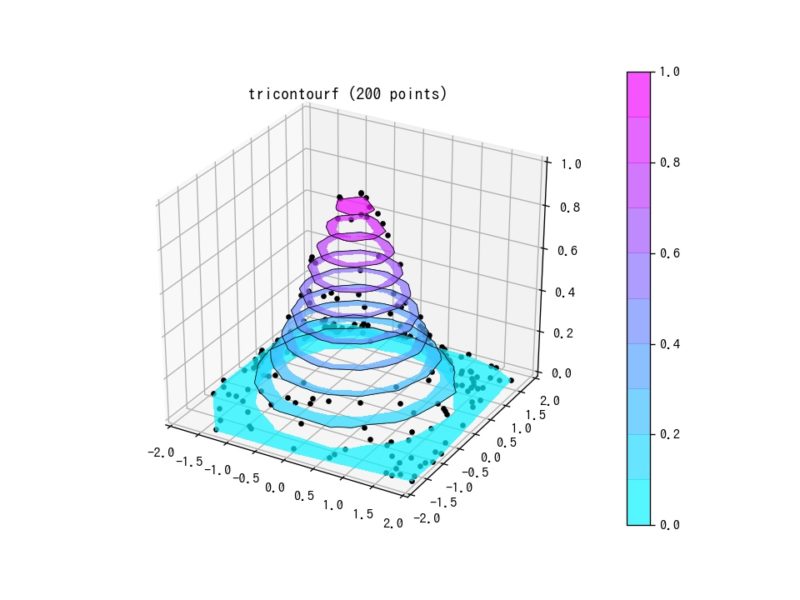
ax.tricontour(x, y, z)を使用すると、構造化されていないデータを近似して等高線を表示できます。
同様に、ax.tricontourfを使えば構造化されていないデータの塗りつぶし等高線を表示できます。ax.plot(x, y, z, ‘ko’, ms=3)でデータポイントを黒丸で示し、fig.colorbar(cntr1, ax=ax)でカラーバーを表示します。
回転アニメーション
注意点と応用のヒント
- データ密度:データポイントが少なすぎると、不自然な等高線が生成される場合があります
- 三角形分割:tricontourfは内部でDelaunay三角形分割を使用しています。必要に応じてmatplotlib.triモジュールを使って三角形分割をカスタマイズできます
- 視覚効果:適切なカラーマップと等高線レベルの選択が視覚的な理解を大きく向上させます
- 補間:データが不足している領域では、より適切な補間方法を検討することが重要です
tricontourfは、地形データ、気象データ、シミュレーション結果など、様々な非構造データの可視化に適しています。特に不規則な測定点から得られたデータを美しく表現したい場合に有用なツールです。
参考

Triangular 3D filled contour plot — Matplotlib 3.10.9 documentation
matplotlib.org

matplotlib.axes.Axes.tricontourf — Matplotlib 3.10.9 documentation
matplotlib.org

コメント