はじめに
この記事は、matplotlib を使用して3D wireframeグラフを作成する際に、X軸方向またはY軸方向のみのデータを表示する方法を解説しています。通常の3D wireframeグラフでは両方向のグリッドが表示されますが、特定の方向のみを強調したい場合の実装テクニックを紹介しています。
コード

解説
モジュールのインポート
図の作成
subplot_kw={‘projection’: ‘3d’}は、add_subplot(111, projection=’3d’)と同じ機能を持ちます。
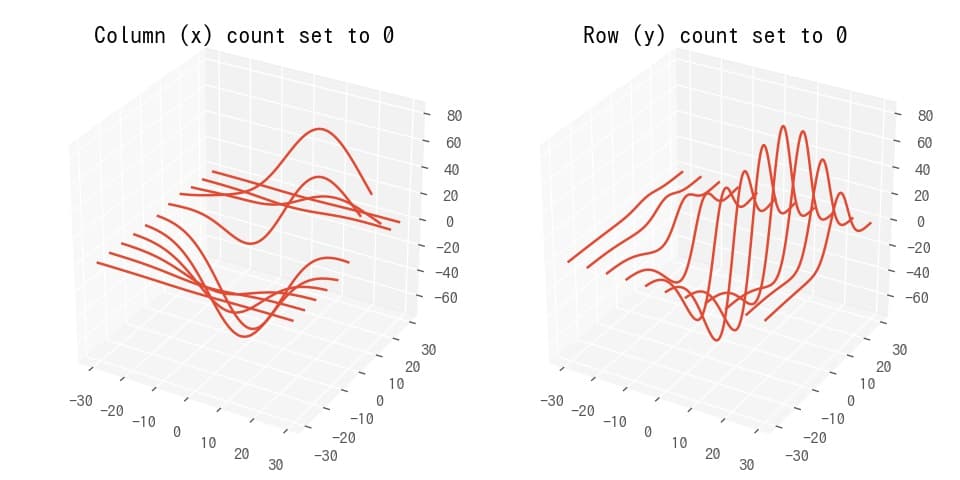
一方向wireframeグラフの作成
ccount や rcount の値を0に設定することで、対応する方向(X軸またはY軸)のデータを非表示にすることができます。
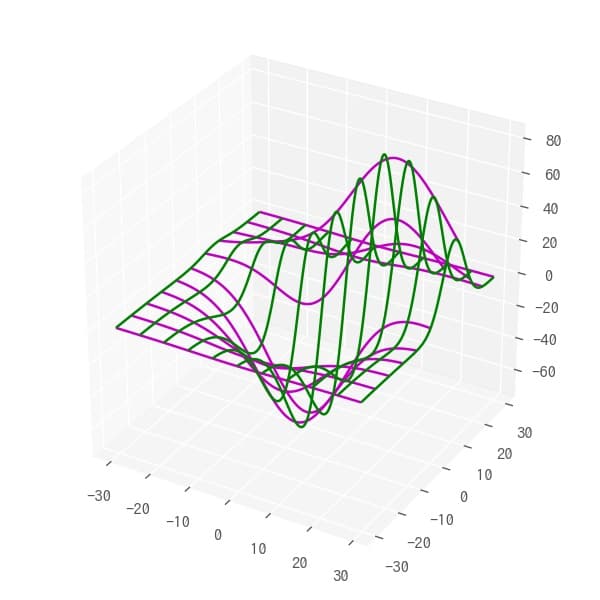
各方向で色を変えて描写
参考

mplot3d tutorial — Matplotlib 2.0.2 documentation
matplotlib.org

mplot3d example code: wire3d_zero_stride.py — Matplotlib 2.0.2 documentation
matplotlib.org

コメント