はじめに
この記事では、scikit-imageライブラリのmorphologyモジュールに含まれるsquare関数を使用して、さまざまなサイズの正方形構造化要素を生成する方法について解説します。構造化要素は画像処理や形態学的操作において重要な役割を果たします。
コード
解説
モジュールのインポートなど
バージョン
構造化要素の生成
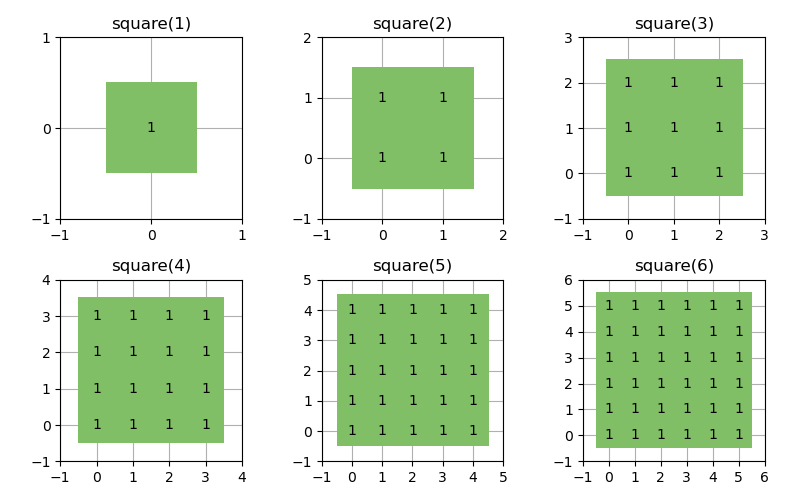
辞書形式でwidth(height)が1から6のsquareを作成します。
構造化要素の表示
まず、plt.figure(figsize=(8,5))で図全体のサイズを設定し、fig.add_subplot(2, 3, idx)で各サブプロットを順番に生成します。構造化要素はax.imshow(struc)で表示します。
各ピクセルの値は、2重のfor文とax.textを使って各セルの中央に表示します。
目盛りは、ax.xaxis.set_major_locator(ticker.MultipleLocator(1))を使って1単位ごとに表示します。
この設定の後でax.grid()を実行すると、1単位ごとにグリッド線が表示されます。
ax.set(xlim=(-1,struc.shape[0]),ylim=(-1,struc.shape[0]))で、各構造化要素のサイズに合わせて軸の表示範囲を設定します。
ax.set_axisbelow(True)を使うと、グリッド線が他の要素の背面に表示されます。
最後にidx += 1で変数を増分し、次のサブプロット作成に進みます。
まとめ
scikit-imageのmorphologyモジュールに含まれるsquare関数を使うことで、簡単にさまざまなサイズの正方形構造化要素を生成できることを学びました。これらの構造化要素は、画像の膨張・収縮などの形態学的操作に利用でき、画像処理において重要なツールとなります。
参考

Generate footprints (structuring elements) — skimage 0.26.1rc0.dev0 documentation
scikit-image.org

skimage.morphology — skimage 0.26.1rc0.dev0 documentation
scikit-image.org

コメント