 matplotlib Animation
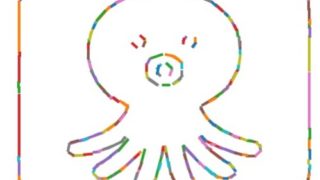
 [matplotlib animation] 39. ハフ変換により検出した線を順次表示するアニメーション
matplotlib の FuncAnimation を使って OpenCV のハフ変換で検出した直線を順次表示するアニメーション作成方法を解説。画像処理と可視化技術を組み合わせた実践的なPythonプログラミング例を紹介しています。
 matplotlib Animation
  matplotlib 3D
  matplotlib 3D
  matplotlib Animation
  matplotlib Animation
  matplotlib
  matplotlib Animation
  matplotlib Animation