 matplotlib 3D
 [matplotlib 3D] 13. 3Dグラフでベクトル
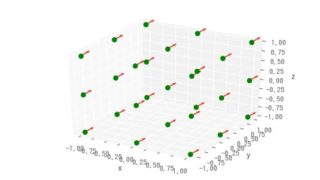
3Dグラフ上にベクトル場を可視化する方法をmatplotlibのquiver関数を使って解説します。空間内のベクトルの向きと大きさを直感的に理解するための表現方法と実装例を紹介しています。
matplotlib 3D  matplotlib 3D
  matplotlib 3D
  matplotlib 3D
  matplotlib 3D
  matplotlib 3D
  matplotlib 3D
  matplotlib 3D