 python
 [SciPy] 3. ndimageによる画像処理
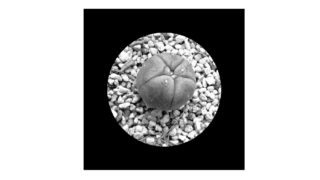
SciPyのndimageモジュールを使った画像処理の基本と応用を解説。フィルタリング、形態学的処理、オブジェクト測定、幾何学的変換などの機能と実践的な使用例を通じて、多次元配列データの処理方法を詳しく紹介しています。
python 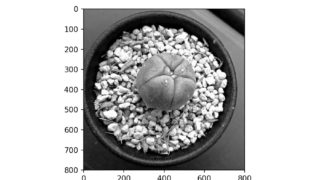 matplotlib
 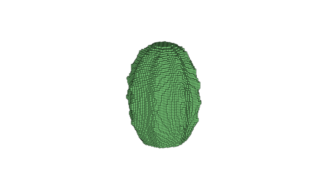 matplotlib 3D
 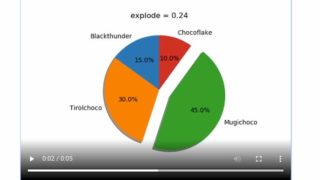 matplotlib Animation
  matplotlib Animation
  matplotlib
  matplotlib