 matplotlib 3D
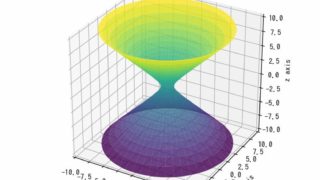
 [matplotlib 3D] 38.双曲面(Hyperboloid)
このページでは、matplotlibのmplot3dを使用して双曲面(Hyperboloid)をグラフ化する方法を解説します。3次元空間における双曲面の数学的表現と実装例を通じて、視覚的に美しい数学モデルの作成方法を学びましょう。
matplotlib 3D  matplotlib 3D
  matplotlib Animation
  matplotlib 3D
  NumPy
NumPy  matplotlib 3D
 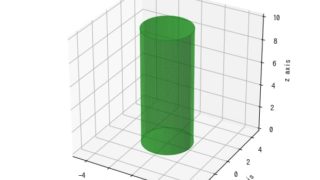 matplotlib 3D NumPy