Loading [MathJax]/extensions/tex2jax.js

[scikit-image] 107. skimageで画像のヒストグラムを作成する(exposure. histogram)

matplotlib

はじめに

skimageのexposure. histogramで画像のヒストグラムを作成する方法について説明する。画像のヒストグラムとは、各ピクセルの値が画像全体でどの程度あるかを視覚的に表示したものである。また、skimage, numpy, matplotlibの各ライブラリでヒストグラムを作成する関数を比較した結果も説明する。

解説

モジュールのインポートなど

import matplotlib.pyplot as plt
from skimage import exposure, img_as_float
from skimage.color import rgb2gray
import numpy as np
view raw expo_histo.py hosted with ❤ by GitHub

バージョン

#version
import matplotlib,skimage
print(matplotlib.__version__)
print(skimage.__version__)
print(np.__version__)
3.5.0
0.18.3
1.21.4
view raw expo_histo.py hosted with ❤ by GitHub

画像の読み込み

# read image
img = plt.imread("sumiremaru.jpg")
img1 = rgb2gray(img_as_float(img))
img1.shape
#(810, 810)
view raw expo_histo.py hosted with ❤ by GitHub

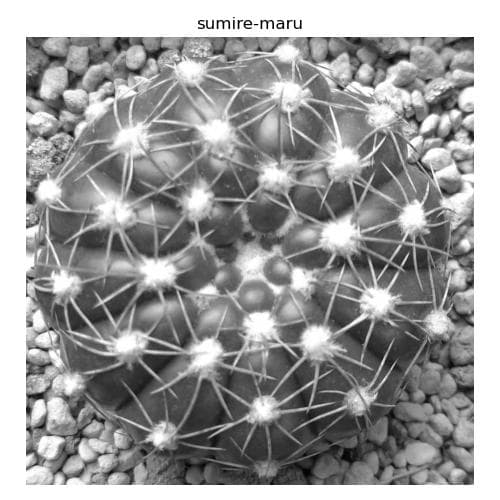
パロディア属スミレ丸の画像を読み込む。img_as_floatでデータ範囲を0-1にし、rgb2grayによりグレースケール画像に変換した。

読み込んだ画像を表示すると以下のようになる。

fig, ax = plt.subplots(1,1,figsize=(5,5))
ax.imshow(img1,cmap="gray")
ax.set_title("sumire-maru")
ax.axis("off")
plt.tight_layout()
plt.savefig("expo_histo_1.jpg",dpi=100)
plt.show()
view raw expo_histo.py hosted with ❤ by GitHub

ヒストグラムデータの作成

exposure.histogram

expo_hist,expo_bin = exposure.histogram(img1,nbins=10)
view raw expo_histo.py hosted with ❤ by GitHub

ヒストグラム化したい画像とヒストグラムの計算に使用するビンの数を指定する。

np.histogram

np_hist,np_bin = np.histogram(img1,bins=10)
view raw expo_histo.py hosted with ❤ by GitHub

ヒストグラム化したい画像とヒストグラムの計算に使用するビンの数を指定する。binのとる範囲は画像の最小値と最大値の間の範囲となる。

plt.hist (ax.hist)

plt_hist, plt_bins, patches = ax.hist(img1.flatten(), bins=10)
view raw expo_histo.py hosted with ❤ by GitHub

ヒストグラム化したい画像とヒストグラムの計算に使用するビンの数を指定する。画像は1次元配列に変換する必要がある。その他はnp.histogramと同様となる。

binの比較

len(expo_bin),len(np_bin),len(plt_bins)
#(10, 11, 11)
view raw expo_histo.py hosted with ❤ by GitHub

skimage.exposure.histogramのビンのみ形状が10で、numpyとmatplotlibのヒストグラムのビンは11となる。これはskimageのヒストグラムのビンの値はビンの中心となっているためである。一方、numpyとmatplotlibはビンのエッジを返すためで形状が11となる。

頻度の比較

expo_hist==np_hist
#array([ True, True, True, True, True, True, True, True, True,
# True])
expo_hist==plt_hist
#array([ True, True, True, True, True, True, True, True, True,
# True])
view raw expo_histo.py hosted with ❤ by GitHub

頻度の値については、skimage, numpy, matplotlibで同じとなる。

ヒストグラムの表示

fig, ax = plt.subplots(dpi=100)
ax.bar(np_bin[:-1], np_hist,width=np.diff(np_bin)[0],alpha=.5,label="np.histogram,bins[:-1]")
ax.bar(expo_bin, expo_hist,width=np.diff(expo_bin)[0],alpha=.5,label="exposure.histogram")
ax.bar(np_bin[1:], np_hist,width=np.diff(np_bin)[0],alpha=.5,label="np.histogram,bins[1:]")
plt_hist, plt_bins, patches = ax.hist(img1.flatten(),bins=10,alpha=.5,color="C3",label="plt.hist")
for direction in ["right", "top"]:
ax.spines[direction].set_visible(False)
ax.legend(bbox_to_anchor=(1, 0.8))
ax.set(xlabel="bins",ylabel="Frequency")
plt.savefig("expo_histo_2.jpg",dpi=100)
plt.show()
view raw expo_histo.py hosted with ❤ by GitHub

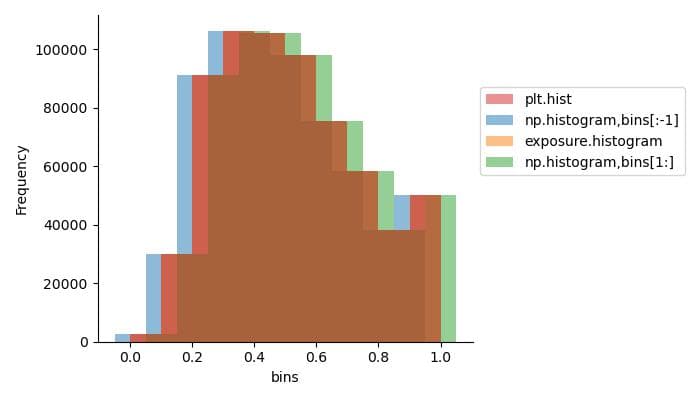
skimage, numpy, matplotlibで作成したヒストグラムデータをmatplotlibのbarで表示すると以下のようになる。numpyのヒストグラムを表示するには、np_bin[:-1]かnp_bin[1:]として配列の形状を揃える必要がある。
matpltlibのax.histの場合、skimageのヒストグラムと同様にbinの中央の値でbarを表示するので、matpltlibとskimageのヒストグラムは同じようになる。

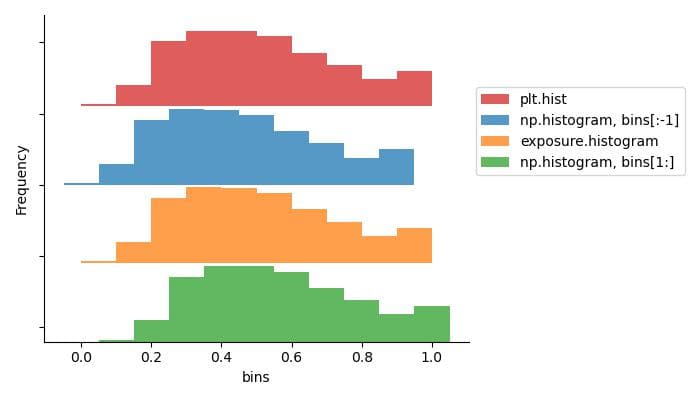
オフセットをかけて表示すると以下のようになる。

## offset
offset=-110000
fig, ax = plt.subplots(dpi=100)
ax.bar(np_bin[:-1], np_hist,width=np.diff(np_bin)[0],alpha=.75,label="np.histogram, bins[:-1]")
ax.bar(expo_bin, expo_hist,bottom=offset,width=np.diff(expo_bin)[0],alpha=.75,label="exposure.histogram")
ax.bar(np_bin[1:], np_hist,bottom=2*offset,width=np.diff(np_bin)[0],alpha=.75,label="np.histogram, bins[1:]")
plt_hist, plt_bins, patches = ax.hist(img1.flatten(),bins=10,bottom=-1*offset,alpha=.75,color="C3",label="plt.hist")
for direction in ["right", "top"]:
ax.spines[direction].set_visible(False)
ax.legend(bbox_to_anchor=(1, 0.8))
ax.set(xlabel="bins",ylabel="Frequency",yticklabels="")
plt.savefig("expo_histo_3.jpg",dpi=100)
plt.show()
view raw expo_histo.py hosted with ❤ by GitHub

規格化(normalize)

## normalize
expo_hist2,expo_bin2 = exposure.histogram(img1,nbins=10,normalize=True)
expo_hist2.sum()
#1.0
view raw expo_histo.py hosted with ❤ by GitHub

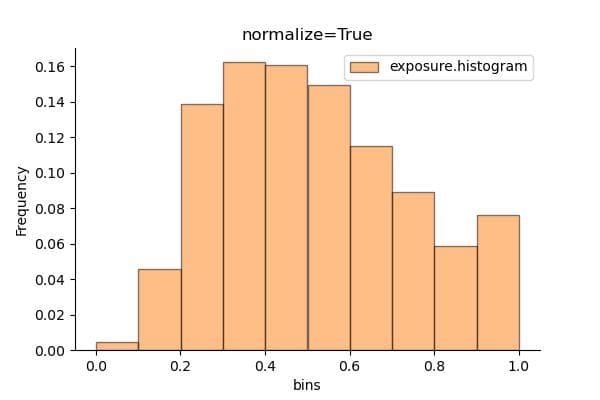
skimageでは、normalize=Trueでヒストグラムの規格化(正規化)することができ、頻度の値の合計は1となる。

規格化したヒストグラムは以下のようになる。

fig, ax = plt.subplots(dpi=100)
ax.bar(expo_bin2, expo_hist2,width=expo_bin2[1]-expo_bin2[0],alpha=.5,color="C1",edgecolor="k",label="exposure.histogram")
ax.set_title("normalize=True")
for direction in ["right", "top"]:
ax.spines[direction].set_visible(False)
ax.legend()
ax.set(xlabel="bins",ylabel="Frequency")
plt.savefig("expo_histo_4.jpg",dpi=100)
plt.show()
view raw expo_histo.py hosted with ❤ by GitHub

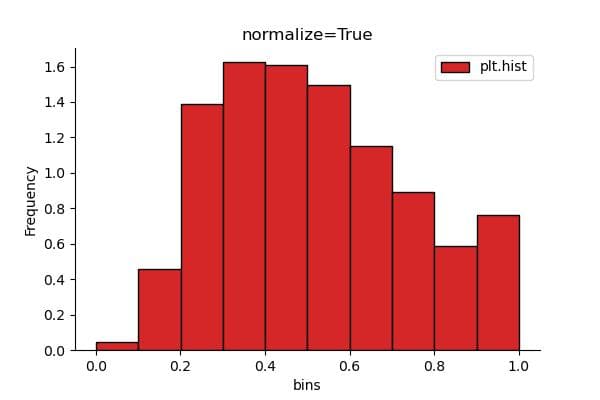
一方、matplotlibで規格化するには、density=Trueとする。その結果は以下のようになる。

fig, ax = plt.subplots(dpi=100)
plt_hist, plt_bins, patches = ax.hist(img1.flatten(),bins=10,color="C3",edgecolor="k",density=True,label="plt.hist")
ax.set_title("normalize=True")
for direction in ["right", "top"]:
ax.spines[direction].set_visible(False)
ax.legend()
ax.set(xlabel="bins",ylabel="Frequency")
plt.savefig("expo_histo_5.jpg",dpi=100)
plt.show()
view raw expo_histo.py hosted with ❤ by GitHub

これの頻度の合計値はそのままでは1とならない。1にするには、ビンの幅(np.diff(plt_bins)[0])をかける必要がある。

plt_hist.sum()
#10.008340283569641
plt_hist.sum()*np.diff(plt_bins)[0]
#1.0
view raw expo_histo.py hosted with ❤ by GitHub

np.histogramの場合も同様となる。

np_hist,np_bin = np.histogram(img1,bins=10,density=True)
np_hist.sum()
#10.008340283569641
view raw expo_histo.py hosted with ❤ by GitHub
コードをダウンロード(.pyファイル)

コードをダウンロード(.ipynbファイル)

参考

matplotlib.axes.Axes.hist — Matplotlib 3.10.1 documentation
Module: exposure — skimage v0.18.0 docs
numpy.histogram — NumPy v2.2 Manual

コメント