 matplotlib
 [matplotlib] 35. 線とマーカーの間隔を調整した折れ線グラフの作成方法
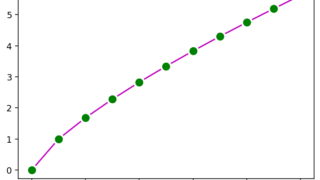
matplotlibを使用して、線とマーカーの間に間隔を設けた折れ線グラフの作成方法を解説します。視認性を高めるための工夫や、markeveryパラメータの活用法、サンプルコードも含めて詳しく説明します。
matplotlib  matplotlib
  matplotlib
  matplotlib
  matplotlib
  matplotlib
  matplotlib
  matplotlib