 matplotlib
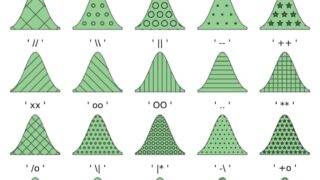
 [matplotlib] 119. hatchで使用可能な模様一覧(ax.fill_between)
matplotlib のhatch機能を使った模様の作り方と一覧を解説。グラフや図表の領域に斜線、格子、点などの模様を適用する方法と、パターンの太さ調整テクニックを紹介。視覚的な区別が必要なデータ表現に役立つ情報を提供。
matplotlib  matplotlib
  matplotlib
  matplotlib
  matplotlib
  python
  matplotlib
  matplotlib