 python
 [scikit-image] 46. Region Adjacency Graph(RAG)を構築した後にNormalized Cut(skimage.future graph)
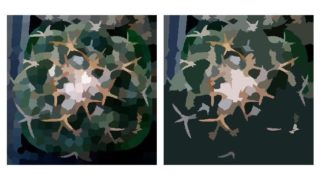
scikit-imageを使用した画像セグメンテーションの高度な手法として、k-meansクラスタリングによる初期分割後にRegion Adjacency Graph(RAG)を構築し、Normalized Cutアルゴリズムを適用する方法を詳細に解説しています。実装例とともに効果的な画像分割のプロセスを学ぶことができます。