はじめに
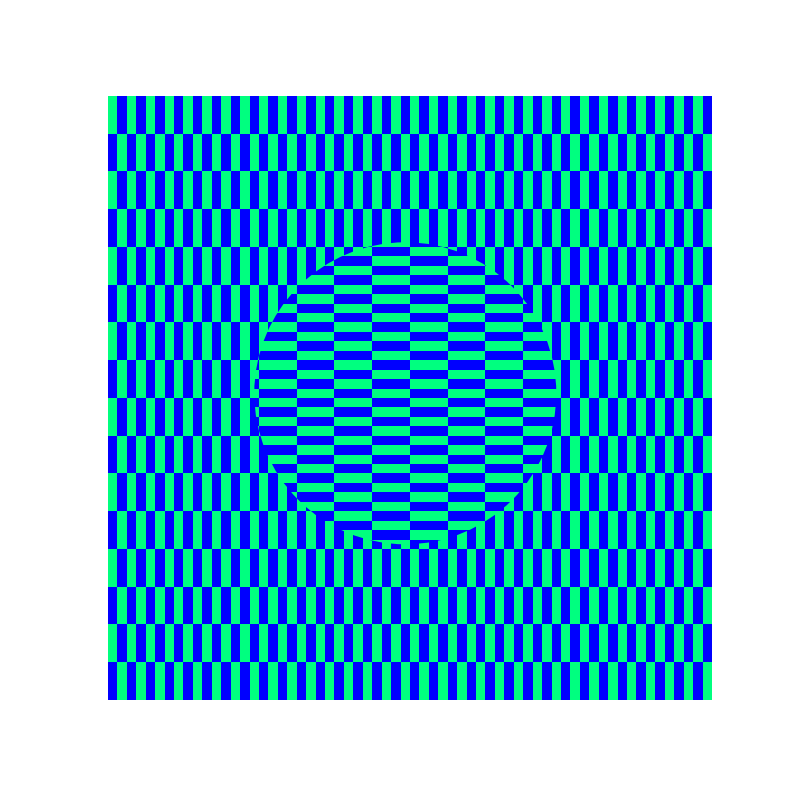
オオウチ錯視は、視覚心理学者の大内正明によって1977年に発表された錯視現象です。中央の長方形領域と周囲の領域が特定のパターンで構成されると、静止画像なのにもかかわらず中央部分が動いて見えるという特徴があります。この錯視効果は、視覚系の動き検出メカニズムと関連しており、脳がパターンの境界部分で矛盾する動きの信号を処理する際に生じると考えられています。本記事では、Pythonのmatplotlibライブラリを使用してオオウチ錯視を再現し、視覚的に体験できるようにします。
コード
解説
モジュールのインポート
データの生成 1
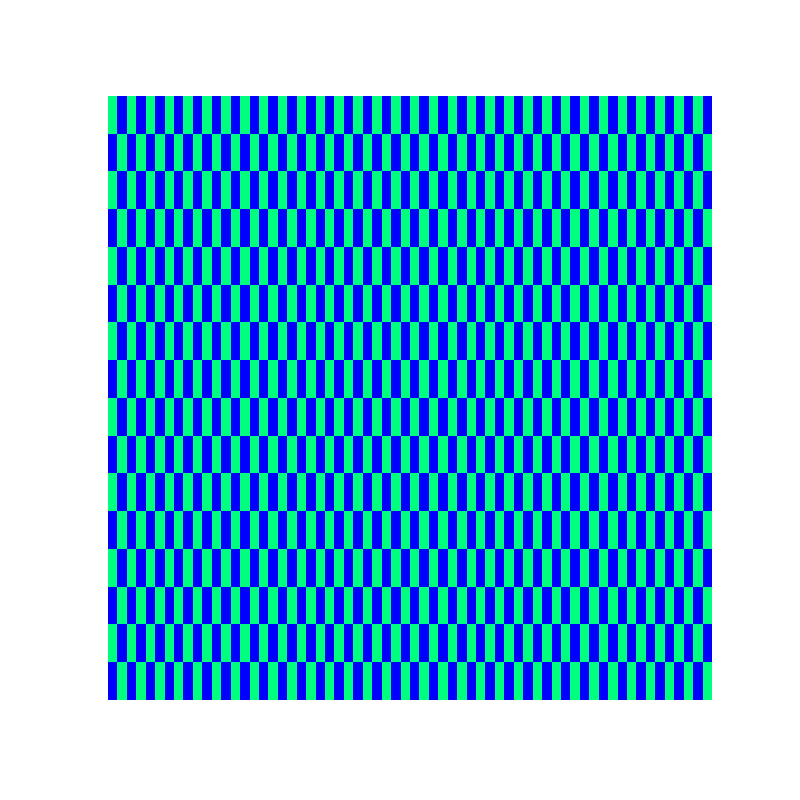
縦方向の模様を作成します。
データの生成 2
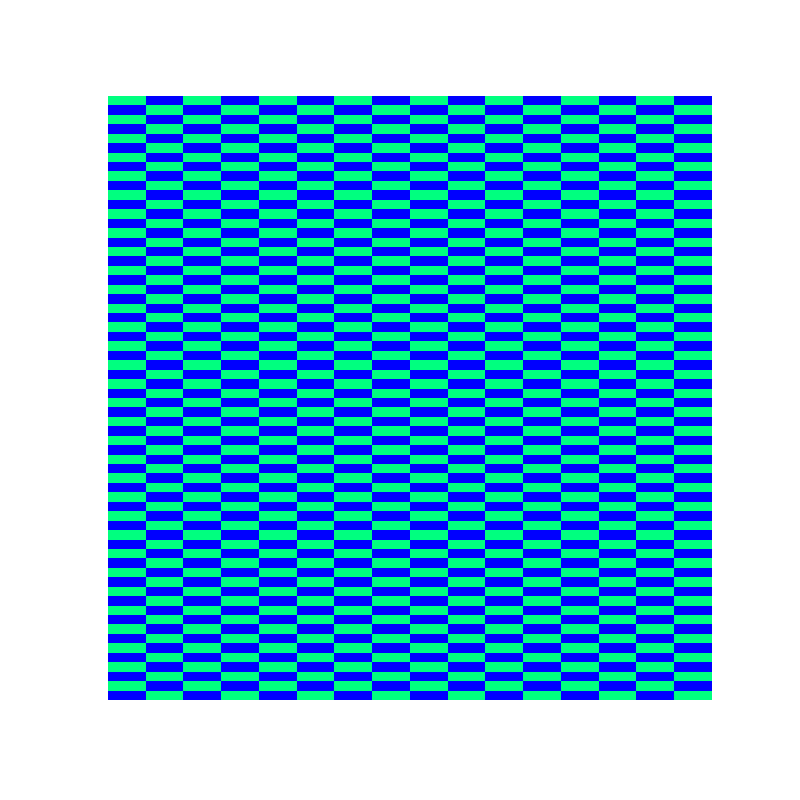
横方向の模様を作成します。
図の表示
ax.imshow(im, cmap=”winter”)を使用して、縦方向の模様をベースとして表示します。
中心の円形部分は、patches.Circleオブジェクトの形状に横方向の模様を切り取ることで作成します。
この切り取り処理は、img.set_clip_path(patch)関数で実行でき、imgをpatchの形状に合わせて切り取って表示できます。
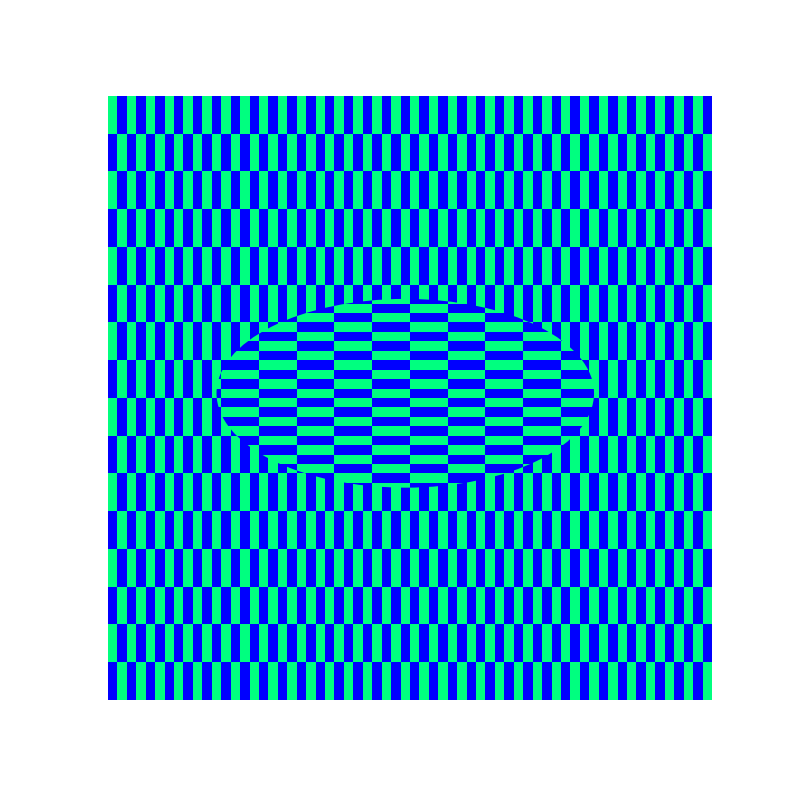
楕円のオオウチ錯視
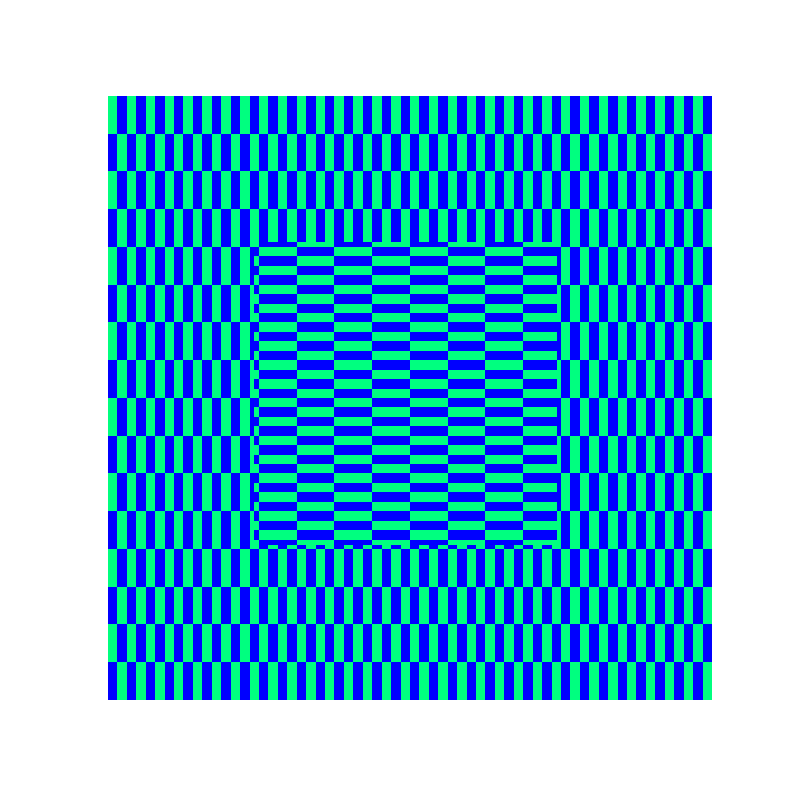
patchesの種類を変えることで切り取る形状の変更は容易にできます。
正方形のオオウチ錯視
まとめ
本記事では、matplotlibを使用してオオウチ錯視を再現する方法を紹介しました。この錯視は静止画像でありながら、中央の領域が動いているように見える不思議な現象です。Pythonのプログラミングを通じて視覚心理学の興味深い現象を体験することができました。このような錯視は、私たちの視覚システムがどのように情報を処理し、時に「錯覚」を生じさせるかを理解する上で重要な手がかりとなります。
参考

オオウチ錯視
錯視
www.araiweb.matrix.jp
[matplotlib] 42. 画像を任意の形に切り取る方法
matplotlibのimshowで画像を任意の形状で切り取って表示する方法について解説します。
sabopy.com
2019.08.27

matplotlib.axes.Axes.set_clip_path — Matplotlib 3.1.0 documentation
matplotlib.org
コメント