はじめに
Pythonのグラフィックライブラリmatplotlibを活用して、パラリンピックの特徴的なシンボルマークを再現する手順を紹介します。
コード&解説
モジュールのインポート
バージョン
アギトの作成
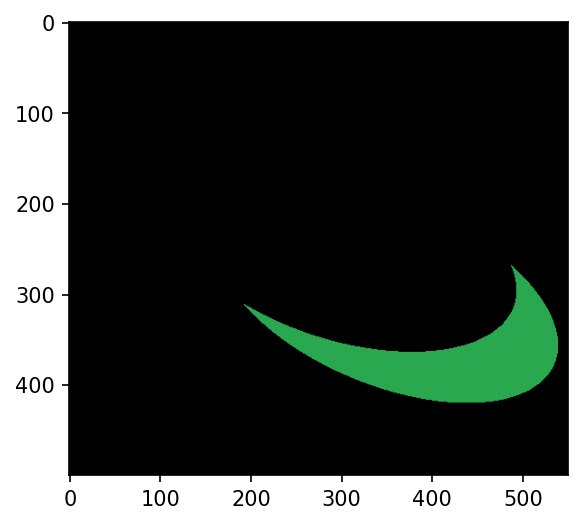
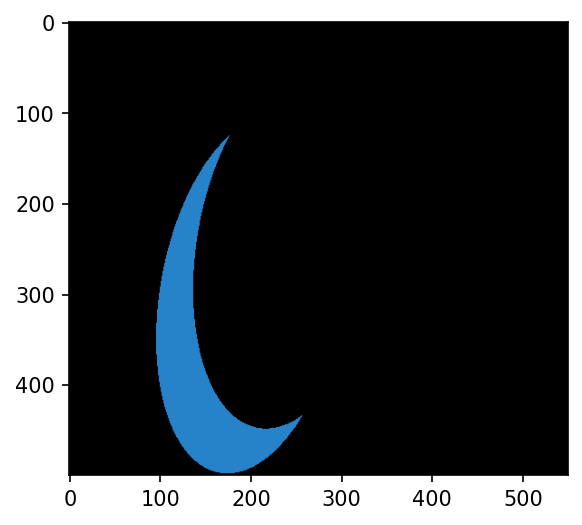
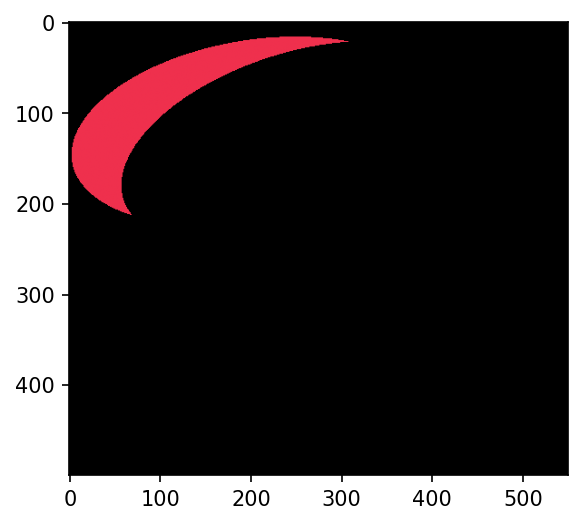
np.zerosで0からなるRGB画像を作成し、skimage.drawのellipseを重ねることで、各色のシンボルを描画する。
緑のアギト
青のアギト
赤のアギト
それぞれのアギトを合体して表示
参考


パラリンピックシンボル - Wikipedia
ja.wikipedia.org

skimage.draw — skimage 0.26.1rc0.dev0 documentation
scikit-image.org
コメント