はじめに
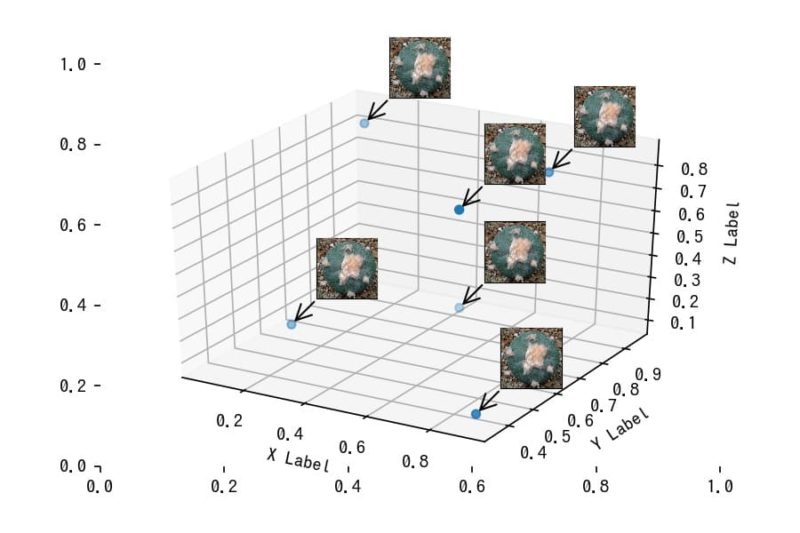
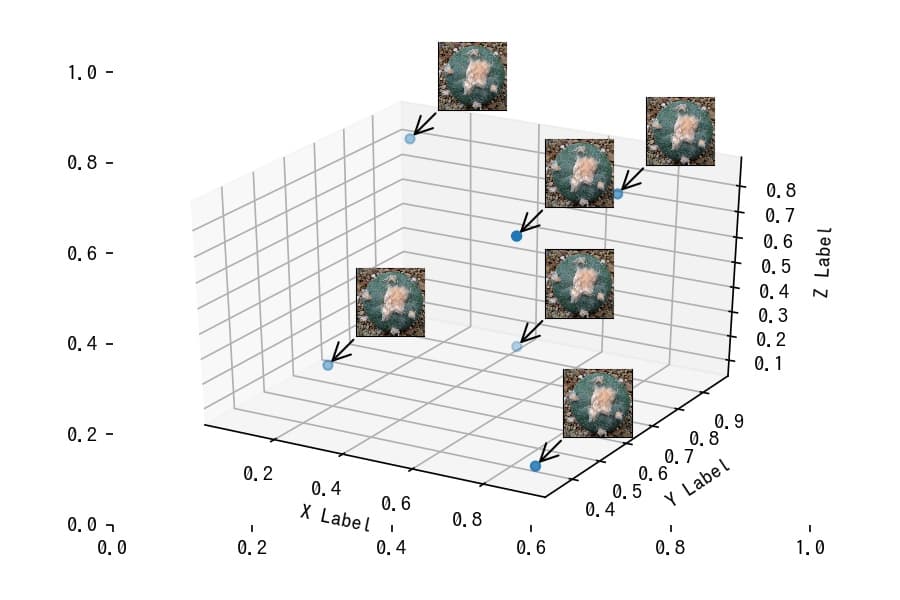
この記事では、Pythonのmatplotlibライブラリを使用して3Dグラフ上に画像を注釈として配置する方法について詳しく解説します。データ可視化をより直感的にするためのテクニックを紹介します。
コード

解説
3Dグラフ上に画像を表示
3Dグラフ上に画像を表示する方法は以下で解説しました。

[matplotlib 3D] 52. 3Dグラフでマーカーとして画像を使用する方法
3Dグラフ上にカスタムマーカーとして画像を表示する手法を解説。matplotlibのmplot3dを使用して立体的な可視化を行い、各データポイントに画像を配置する方法を紹介。アニメーションやインタラクティブな表現にも応用可能。
注釈の表示する関数
画像をOffsetImageに取り込む
変数imはmatplotlib.offsetbox.OffsetImageのインスタンスとして生成され、zoomパラメーターを使用して画像の拡大縮小を調整できます。
OffsetImageをAnnotationBboxに取り込んで注釈を表示
AnnotationBboxにより画像を表示します。 im, xy, xybox=(0,0)の設定では、imをxyの位置から(30,30)離れた場所に表示する意味になりますが、この例ではxyの位置に直接画像が表示されます。xycoords=’data’はxyの位置指定にデータ座標系を使用し、boxcoords=”offset points”は画像表示ボックスの位置調整にポイント座標系を使用することを示します。 pad=0は画像とその外枠との間隔を設定し、arrowprops=dict(arrowstyle=”->”)で矢印のスタイルを指定できます。
最後に、ax.add_artist(ab)を実行して画像を図に追加します。
コードをダウンロード(.pyファイル) コードをダウンロード(.ipynbファイル)参考

3D Scatter Plot with Images as Annotations
I am trying to generate a 3D scatter plot for tSNE embeddings of images from a dataset containing digits from 0 to 9. I ...
AnnotationBbox demo — Matplotlib 3.10.8 documentation
mpl_toolkits.mplot3d — Matplotlib 3.10.8 documentation
Transformations Tutorial — Matplotlib 3.10.8 documentation


コメント