はじめに
ここでは、matplotlibのsubplot()関数と組み合わせてFuncAnimationを使用し、複数の外サイクロイドのアニメーションを作成する方法を解説します。
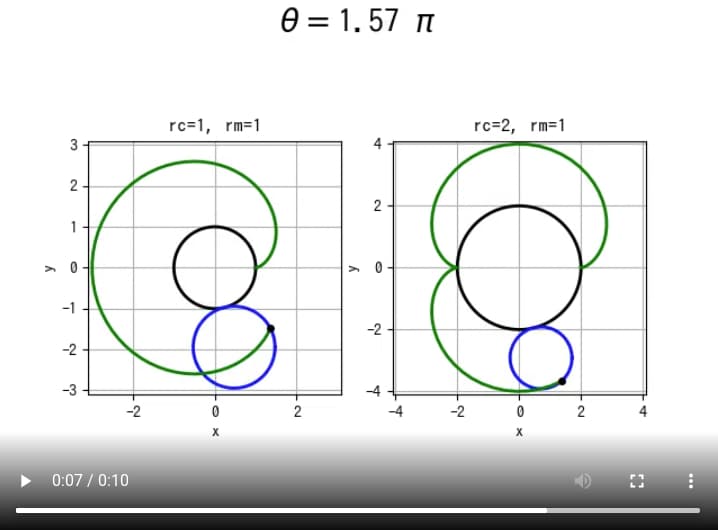
外サイクロイドとは
外サイクロイド(epicycloid)は、ある円が別の円の外側を転がるときに、円周上の1点が描く軌跡のことです。このような曲線は数学的に美しいパターンを形成し、アニメーションで表現すると特に魅力的です。
コード
解説
複数グラフの設定
その他の設定
[matplotlib animation] 14. 外サイクロイド(epicycloid)
matplotlibのFuncAnimationを使用して外サイクロイド(epicycloid)のアニメーションを作成する方法を紹介。Pythonでの実装方法からパラメータの調整まで、数学的な曲線を視覚的に表現する技術を解説します。
sabopy.com
2018.12.17
前述の記事と同様に、axとax2のそれぞれに表示したいグラフを設定します。
subplot全体のタイトルの設定
fig.suptitle() 関数を使用すると、subplot 全体に対するタイトルを設定できます。
2×2のsubplotで表示
上記のコードで、単に fig = plt.figure() と記述すると、グラフ同士が重なってしまい見づらくなります。そこで、fig = plt.figure(figsize=(9,10)) のように figsize パラメータを設定することで、グラフが重ならないよう適切なサイズに調整できます。
3×3のsubplotで表示
同様に、fig = plt.figure(figsize=(12,13)) を設定することでグラフの重なりを防止しています。
コードをダウンロード(.pyファイル) コードをダウンロード(.ipynbファイル)まとめ
matplotlibのsubplot()とFuncAnimationを組み合わせることで、複数のグラフを同時にアニメーション化できます。これにより、異なるパラメータでの比較や、複数の関連するデータの視覚化が可能になります。
このテクニックは、外サイクロイドだけでなく、様々な数学的モデルや物理シミュレーションの可視化にも応用できます。
参考

サイクロイド - Wikipedia
ja.wikipedia.org

matplotlib.animationを利用してgif画像を作る (FuncAnimation) - Qiita
matplotlibはデータ解析の可視化ツールとして一般的に用いられています. 今回は,matplotlib.animation機能を使ってgif画像を作ってみたので,そのコードを紹介します. 最終的には,以下のgifアニメーションを作りた...
qiita.com

matplotlib.pyplot.suptitle — Matplotlib 3.10.8 documentation
matplotlib.org

コメント