はじめに
scikit-learnのmake_regression関数を使用して回帰問題用のランダムデータを生成する方法とその様々なパラメータがデータに与える影響について解説します。このツールは機械学習モデルのテストやベンチマークに役立ちます。
解説
モジュールのインポートなど
バージョン
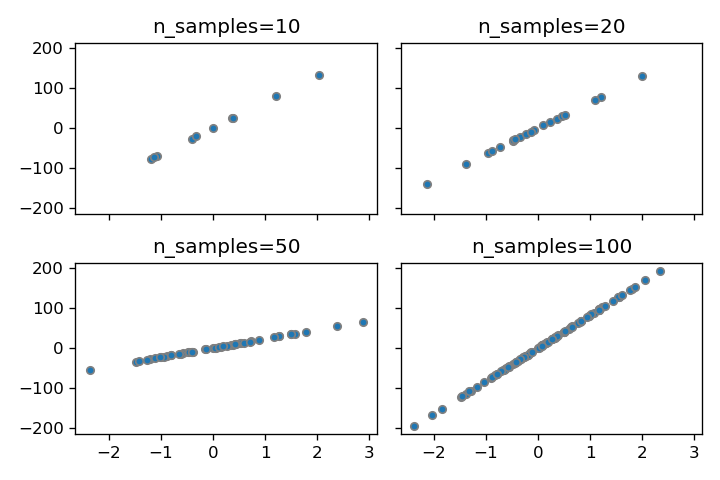
n_samples
n_samplesパラメータを調整することでデータセット内のサンプル数を自由に変更できます。
n_features
データの列数を変えることができます。
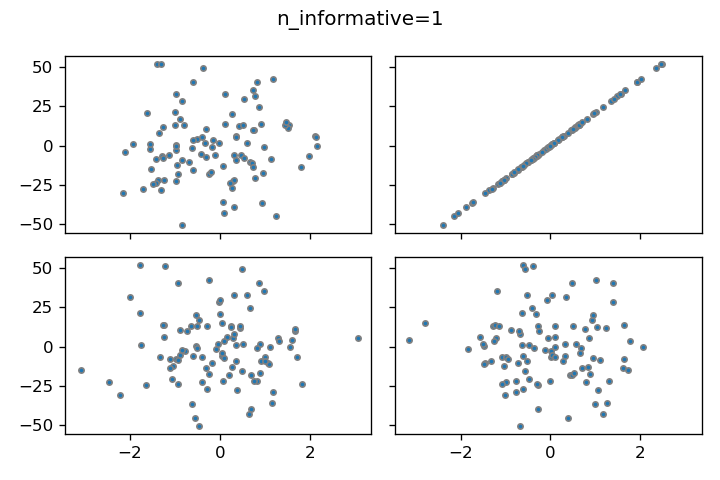
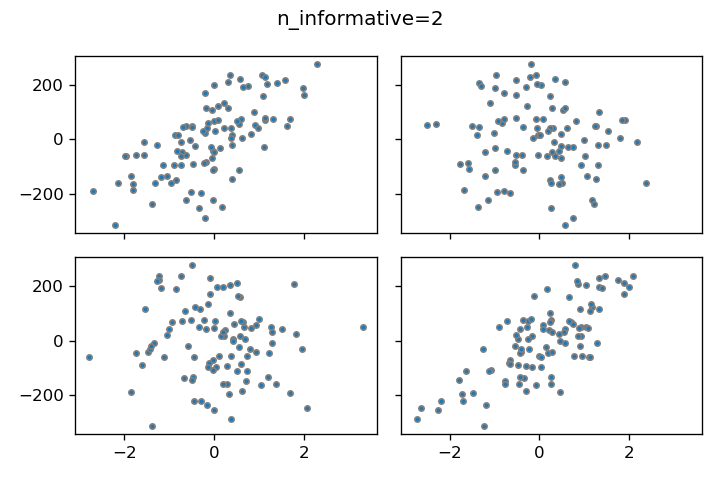
n_informative
線形モデルに適合するデータ列の数を設定できます。パラメータを1と2に設定した場合の結果を比較すると、2の場合は左上と右下のデータポイントが線形モデルに適合していることがわかります。
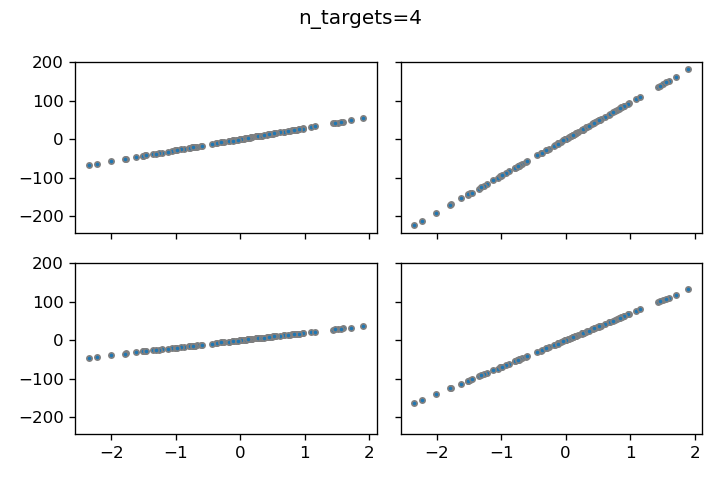
n_targets
n_targetsパラメータは出力値Yの数を指定します。例えば、n_targets=4と設定して異なるYとXの関係をプロットすると、以下のようなグラフが得られます。
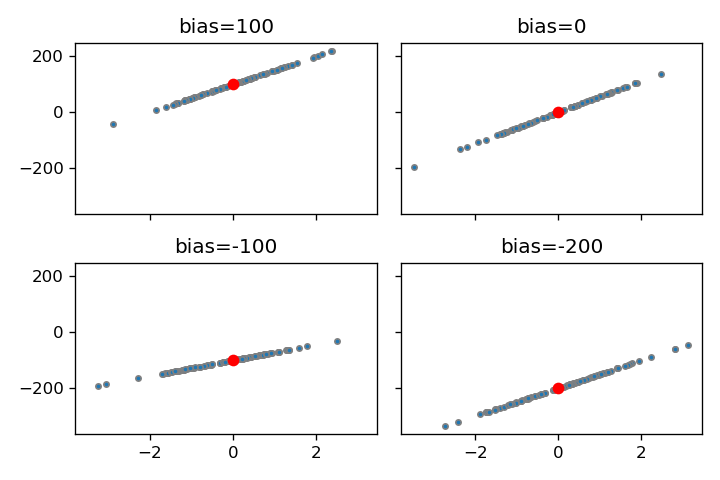
bias
biasは切片の値となります。
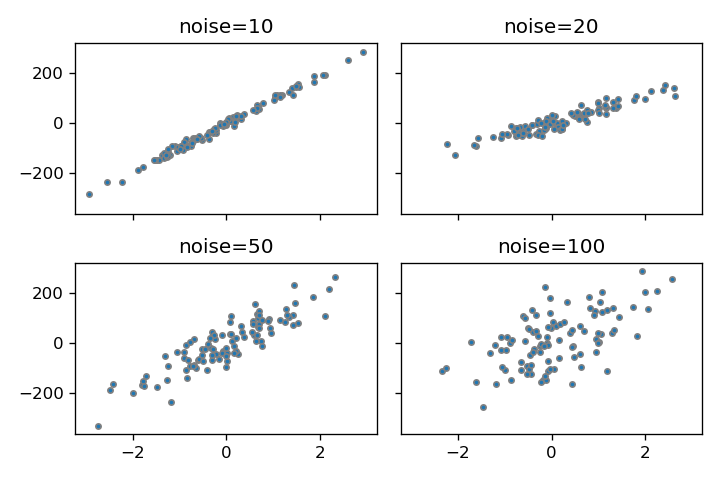
noise
noiseでばらつきを付与できます。
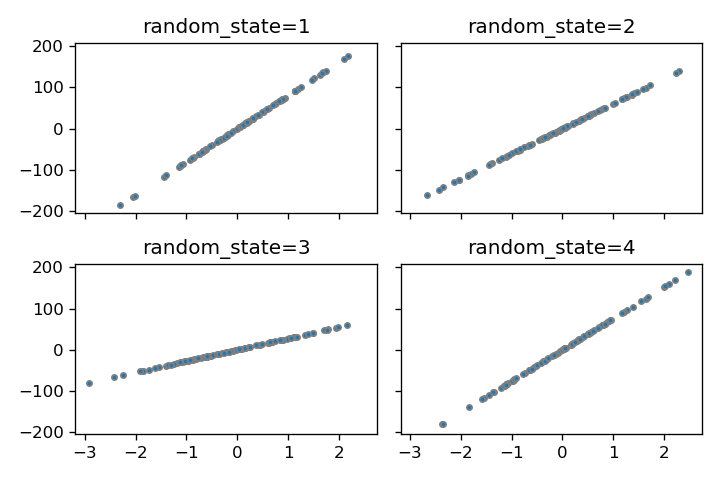
random_state
random_stateパラメータを設定することで、再現可能な乱数を生成できます。
coef
coef=Trueと設定することで線形モデルの係数を取得できます。デフォルト値はFalseです。例えば、n_features=4と指定すると、4つの係数が生成されます。
コードをダウンロード(.pyファイル) コードをダウンロード(.ipynbファイル)まとめ
scikit-learnのmake_regression関数は、回帰分析のためのカスタマイズ可能なランダムデータセットを簡単に生成できるツールです。サンプル数、特徴量の数、ノイズレベルなどの様々なパラメータを調整することで、異なる複雑さの回帰問題に対応したデータを作成できます。これにより、機械学習アルゴリズムの検証や比較が効率的に行えるようになります。
参考

make_regression
Gallery examples: Prediction Latency Effect of transforming the targets in regression model Comparing Linear Bayesian Re...
scikit-learn.org

コメント