はじめに
本記事ではseaborn-imageライブラリのimghist機能について解説します。imghistを使用することで、グレースケール画像とそのヒストグラムを同時に表示することができ、画像データの分布を視覚的に把握することができます。seaborn-imageはmatplotlibベースの画像可視化ライブラリであり、少ないコードで効果的な画像データの可視化が可能です。

コード&解説
インストール
condaの方は
conda install -c conda-forge seaborn-imagepipの方は
pip install -U seaborn-imageでインストールできます。
モジュールのインポート
seaborn_image は isnsとして読み込みます。
バージョン
全体の設定
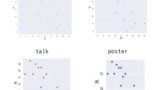
isns.set_context(“talk”)を使用することでフォントサイズなどの表示設定を変更できます。設定オプションには「paper」、「notebook」、「presentation」、「talk」、「poster」の5種類があります。
isns.set_image(cmap=”afmhot”, origin=”upper”)を使用して、デフォルトのカラーマップを”afmhot”に設定し、デフォルトの画像の原点位置を”upper”に指定します。
データの読み込み
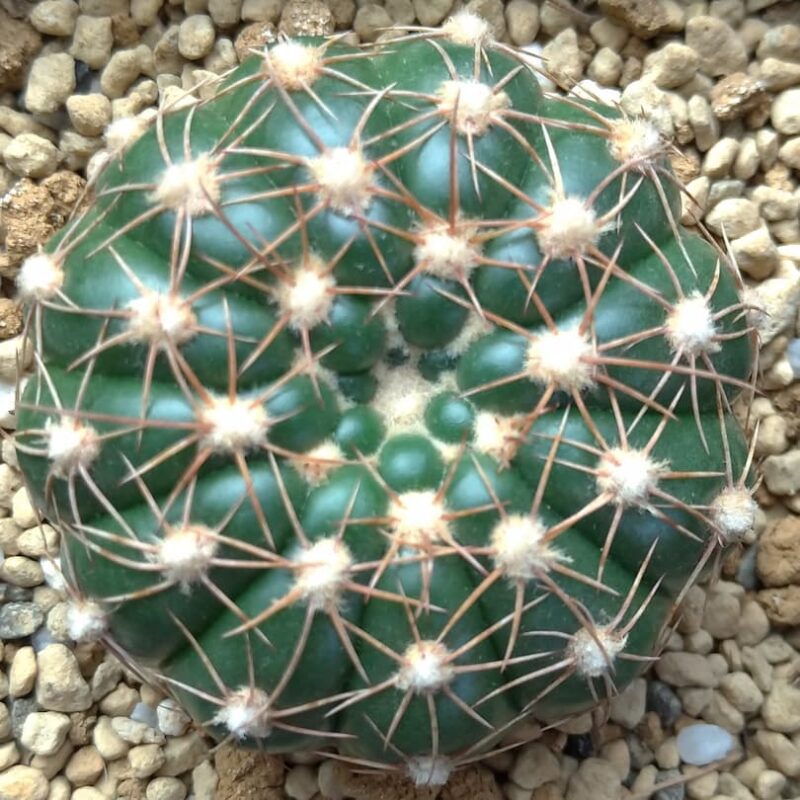
サボテンのすみれ丸の画像を読み込みました。分析には以下の画像を使用しています。
グレースケール画像の作成
skimage.color モジュールの rgb2gray 関数を使用して、RGB画像をグレースケール画像に変換します。
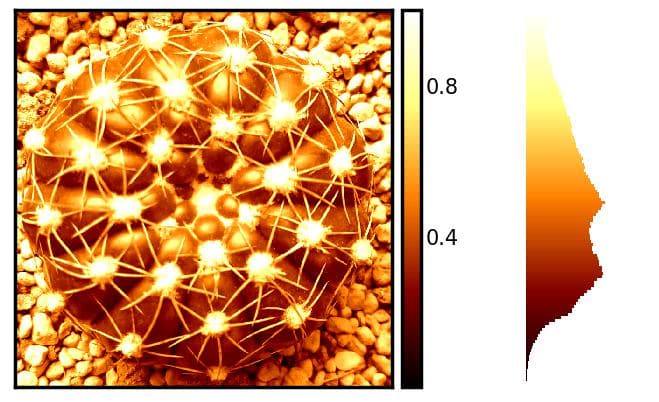
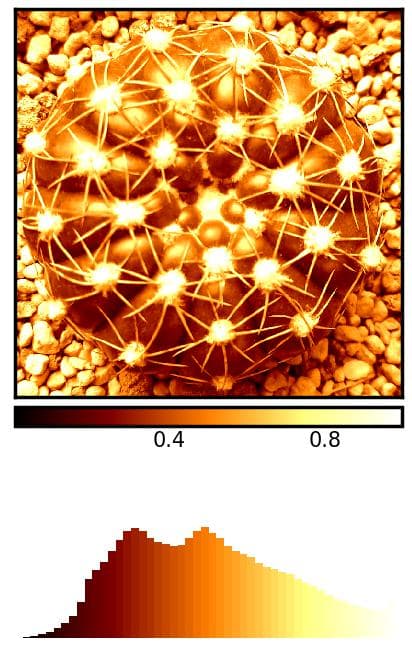
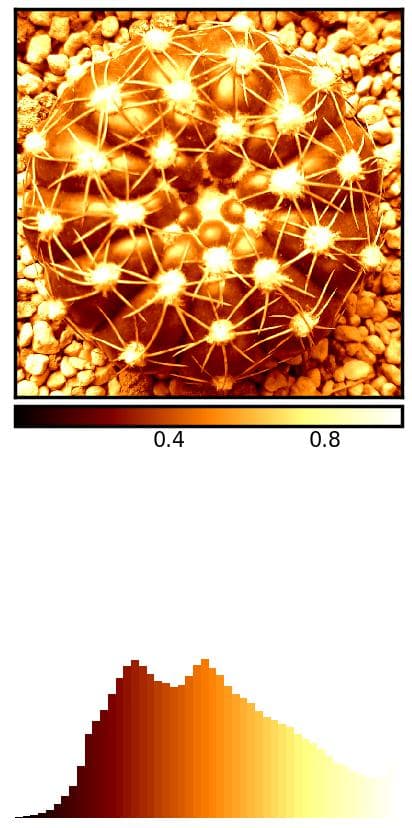
imghistによる画像とヒストグラムの表示
isns.imghist(img_g)だけで下の画像が表示できます。
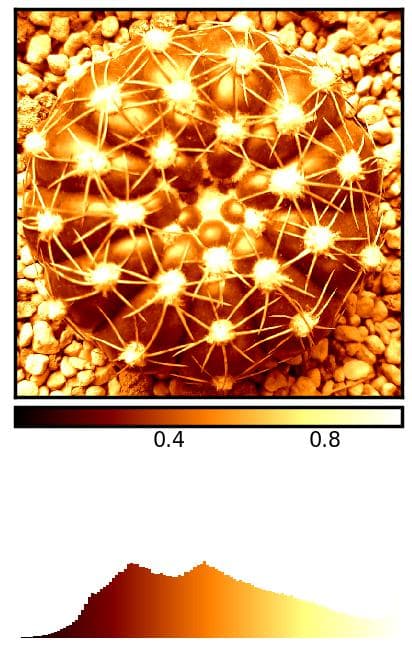
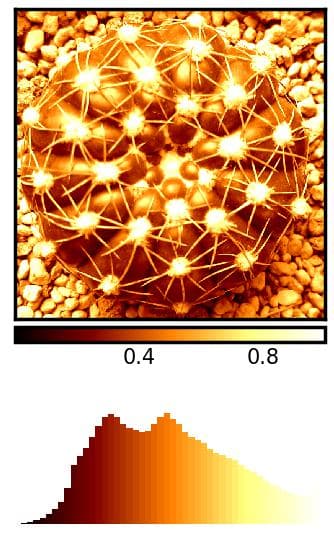
画像とヒストグラムを縦に並べて表示
orientation=”h”で縦に並べて表示できます。
ヒストグラムのbin数
bin数はbinで指定することができます。
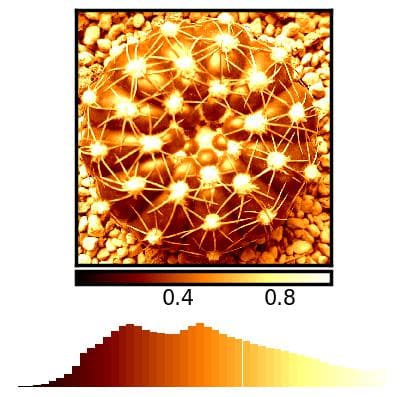
figの大きさの設定
height デフォルトは5
hegihtを4とすると以下のようになります。
hegihtを6とすると以下のようになります。
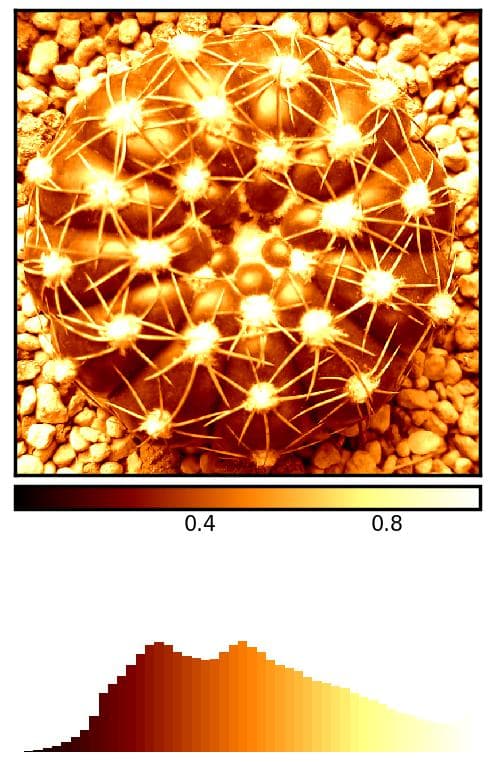
aspect デフォルトは1.75
アスペクト比を調整することで図の大きさを変更できます。アスペクト比を1に設定した場合、以下のように表示されます。
aspect=2.5とした場合は以下のようになります。
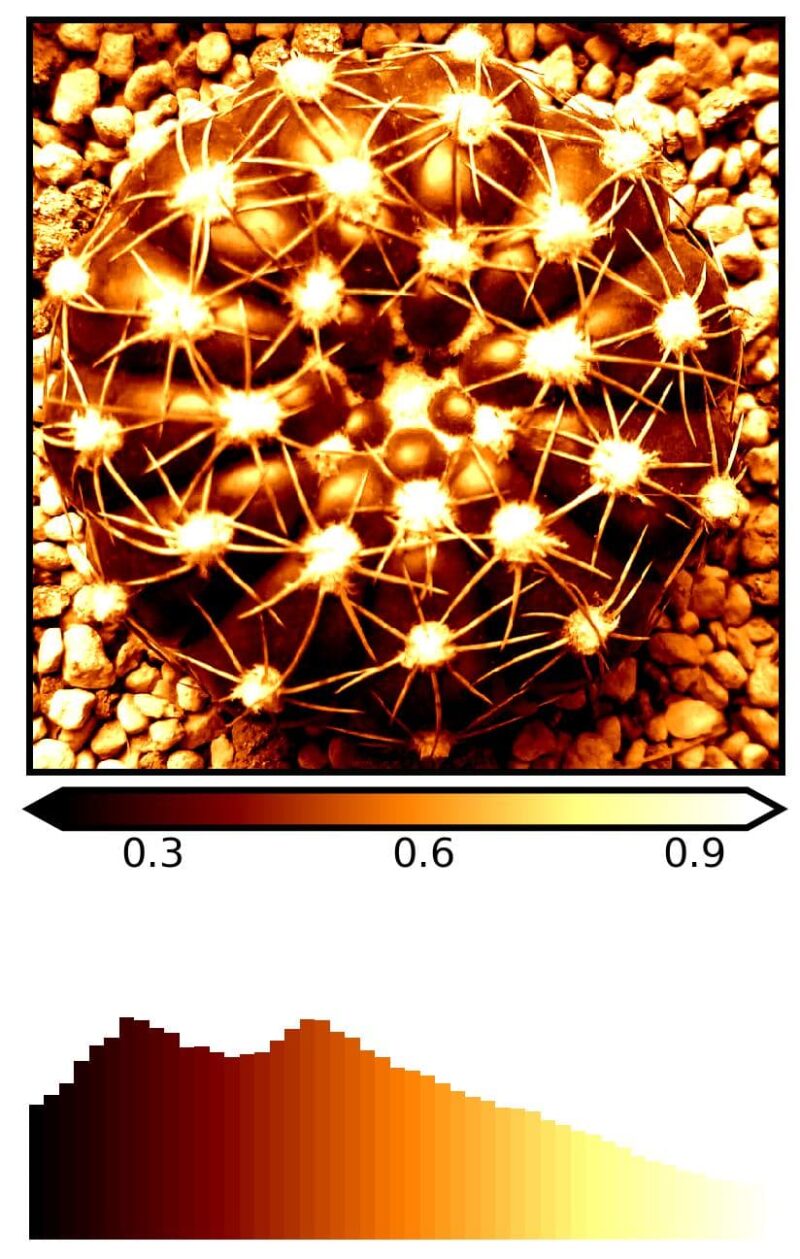
パーセンタイルで表示範囲を設定
robustパラメータとpercパラメータを使用することで、パーセンタイルによる表示範囲を設定できます。例えば、perc=(5,95)と指定すると、以下の図のように表示されます。
まとめ
本記事では、seaborn-imageライブラリのimghist機能について解説しました。この機能を使用することで、グレースケール画像とそのヒストグラムを同時に表示でき、画像データの分布を効率的に分析することができます。
主なポイント:
- matplotlibベースの画像可視化ライブラリであるseaborn-imageの特徴
- imghistによるグレースケール画像とヒストグラムの同時表示方法
- 少ないコードで効果的なデータ可視化を実現する方法
seaborn-imageは、画像処理やデータ分析を行う際の強力なツールとして、より直感的な画像データの理解をサポートします。
参考


コメント