 matplotlib
 [matplotlib] 39. データ値に基づく色分けプロット技法
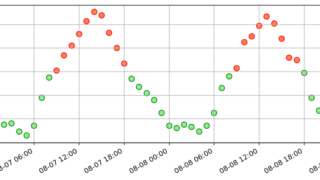
Matplotlibを使用してデータの値に応じてプロットの色を変更する方法について解説します。特に散布図において、データポイントの属性や値に基づいて視覚的に区別する技術を紹介し、実践的な例としてつくば市の気温データを活用します。
matplotlib  matplotlib 3D
  ipywidgets
  matplotlib Animation
  matplotlib
  matplotlib
  matplotlib
  matplotlib 3D