 matplotlib
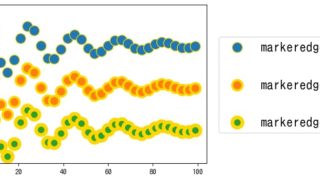
 [matplotlib] 3. データポイントを視覚的に明確に示すマーカー設定のポイント
サイズ、色などの設定方法を解説します。マーカーはデータポイントを視覚的に表現し、グラフの可読性を高める重要な要素です。複数のデータセットを区別するためのマーカー設定の組み合わせ方も紹介しています。
matplotlib 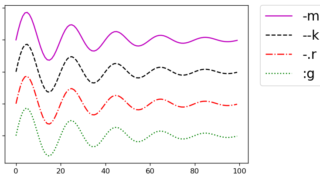 matplotlib
  matplotlib
 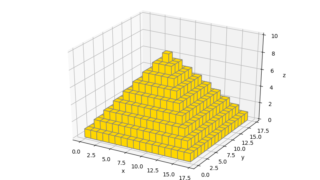 matplotlib 3D
 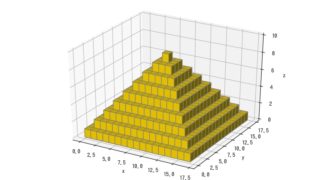 matplotlib 3D
 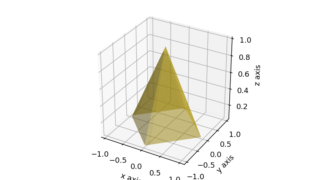 matplotlib 3D
  English articles