 ipywidgets
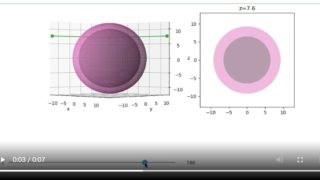
 [ipywidgets] 25. 卵状構造をとる2つの球の任意の高さにおける断面を表示
ipywidgetsのFloatSliderを使用して、3D空間内の卵状構造をとる2つの球体の任意の高さにおける断面図を対話的に表示する方法を解説します。Jupyter NotebookやLabでの実装例を紹介します。
ipywidgets 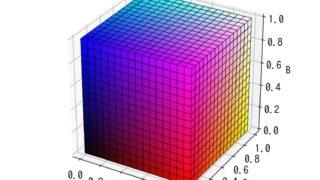 matplotlib 3D
 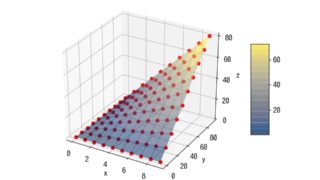 matplotlib 3D
 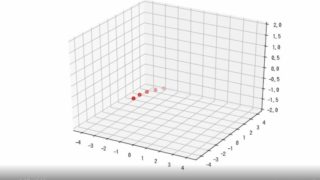 matplotlib 3D
  matplotlib
  matplotlib Animation
  matplotlib 3D
 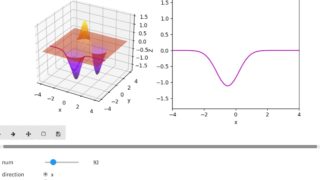 ipywidgets