 matplotlib 3D
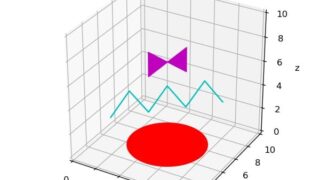
 [matplotlib 3D] 11. 3Dグラフ上に円、線、面などの図形を表示する方法(pathpatch3d)
matplotlibの3Dグラフに円や線、面などの2次元図形を3D空間に投影する方法を解説。pathpatch3dモジュールを使って2Dのパスオブジェクトを3D空間に配置する手法を紹介し、視覚的に豊かな3Dグラフ表現を実現する方法を説明します。
matplotlib 3D  matplotlib Animation
  matplotlib Animation
  matplotlib 3D
 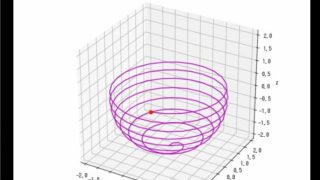 matplotlib Animation
  matplotlib Animation
 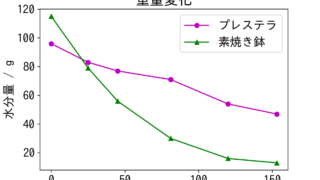 サボテン
サボテン 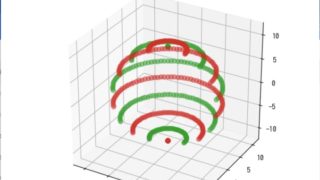 matplotlib 3D