はじめに
このページでは、matplotlibを使用して棒グラフの棒部分にハッチング(模様)を適用する方法について解説します。様々なパターンのハッチングを使って、グラフをより視覚的に区別しやすくする技術を学びましょう。
コード
解説
モジュールのインポート
バージョン
データの生成
indは[1,2,3,4]となります。
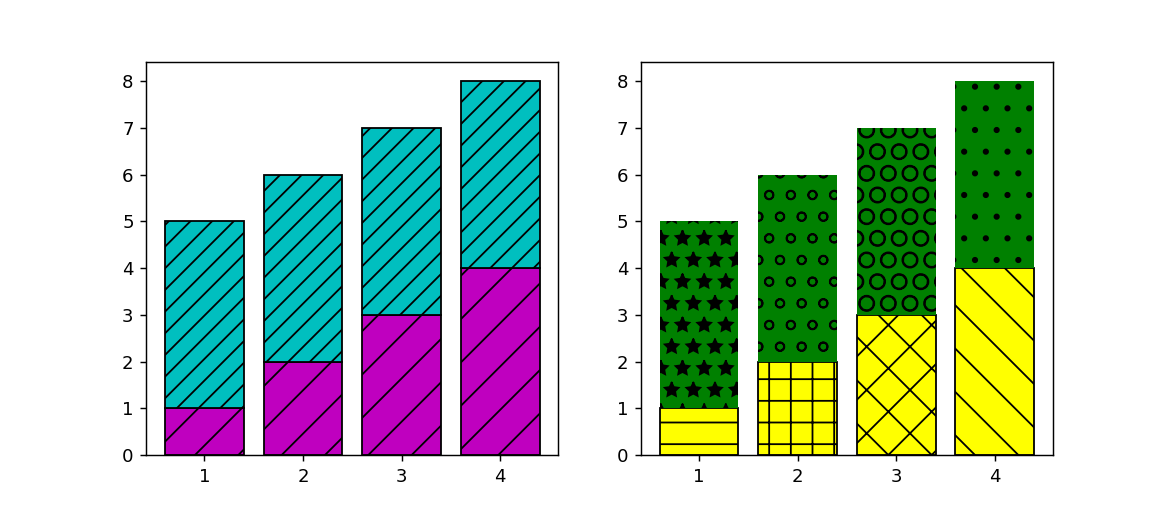
左の棒グラフの設定
bottom=ind パラメータを使用することで、棒グラフを積み上げ形式で表示しています。
下の棒グラフ群には hatch=”/” を適用し、斜線模様を表示させています。
上の棒グラフ群には hatch=’//’ を適用し、二重斜線模様を表示させています。
右の棒グラフの設定
ハッチの種類をpatterns = (‘-‘, ‘+’, ‘x’, ‘\\’, ‘*’, ‘o’, ‘O’, ‘.’)として、
for bar, pattern in zip(bars, patterns):
bar.set_hatch(pattern)
と記述することで、右下の棒から左上にかけて、順番に patterns で指定したハッチングパターンが適用されます。
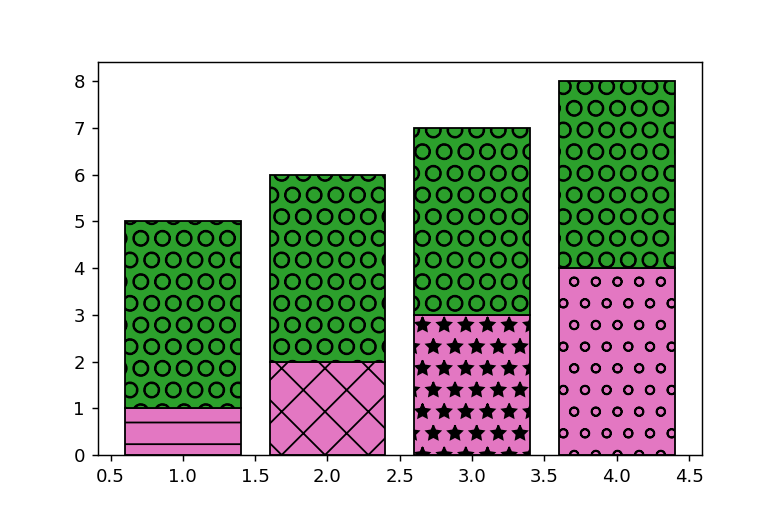
hatchをリストで適用
matplotlib 3.4.0から配列形式でハッチを指定することが可能になった。

Page Not Found — Visualization with Python
matplotlib.org
参考

Hatch demo — Matplotlib 3.11.0 documentation
matplotlib.org

matplotlib.pyplot.bar — Matplotlib 3.11.0 documentation
matplotlib.org

matplotlib.axes.Axes.bar — Matplotlib 3.11.0 documentation
matplotlib.org
コメント