はじめに
この記事では、matplotlibライブラリの「fast」スタイルを使用することによる描画パフォーマンスの向上について検証しています。大量のデータポイントを扱う際の処理速度の改善がどの程度期待できるか、実験を通して具体的な数値と共に解説します。また、どのような状況で「fast」スタイルの使用が効果的であるかについても説明します。
コード
解説
モジュールのインポートなど
%matplotlib を使用して、Jupyter Lab や Notebook 内ではなく別ウィンドウで表示します。バックエンドには Qt5Agg を使用します。
バージョン
データの生成
10,000、100,000、1,000,000個のランダムなデータをそれぞれ作成します。
defaultスタイルでの実行時間
%%timeitを使用してセル内のコードを複数回実行し、平均処理時間を測定します。
fastスタイルでの実行時間計測
fastスタイルの適用
mplstyle.use(‘fast’)を実行することで、matplotlibに「fast」スタイルが適用されます。
実行時間の計測
%%timeitを使用して先ほどと同様に実行時間を計測します。
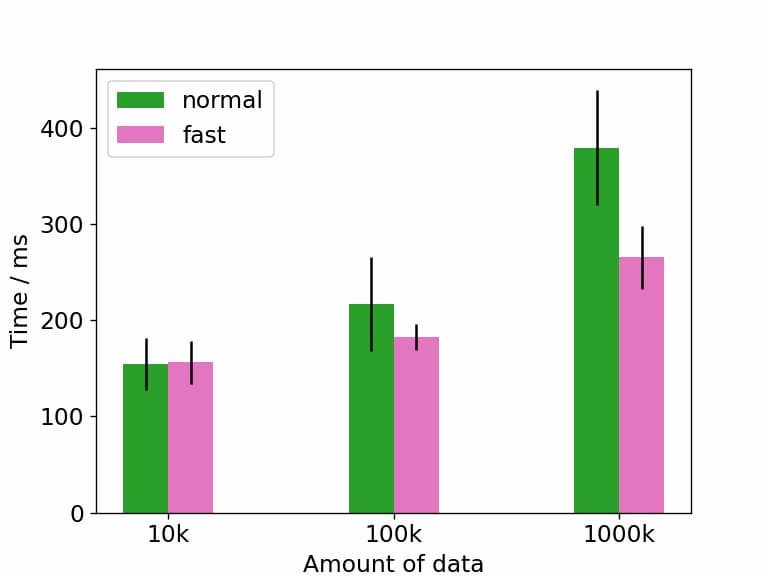
実行時間計測結果の比較
上図から、「fast」スタイルを適用した際の効果はデータ数が多くなるほど顕著になることがわかる。
コードをダウンロード(.pyファイル) コードをダウンロード(.ipynbファイル)参考

Performance — Matplotlib 3.10.9 documentation
matplotlib.org
[matplotlib] 27. 横並び棒グラフ
Pythonのmatplotlibライブラリを使って横並び棒グラフを作成する方法を解説。複数のカテゴリや時系列データを比較する際に役立つグラフ表現のコード例とカスタマイズ方法を紹介します。
sabopy.com
2019.03.23

コメント