はじめに
本記事では、matplotlibのmplot3dモジュールを使って3Dグラフ上に木構造を表示する方法について詳しく解説します。
コード
解説
モジュールのインポートなど
jupyter lab上で表示するために%matplotlib widgetとします。
バージョン
データの生成
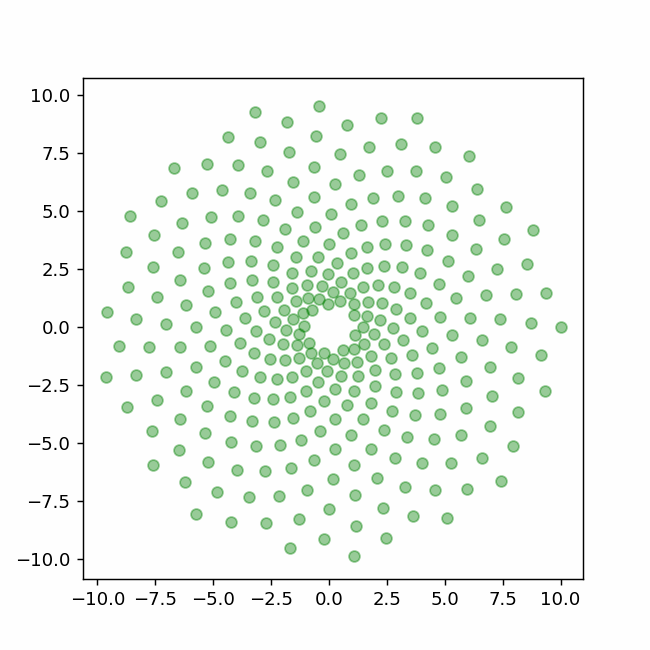
媒介変数的にフラクタルなデータを作成する。
x,yの表示
x,yを平面上に表示すると下のようになる。
木の幹のデータ
円柱を木の幹として表示する。円柱のデータについては下記記事と同じものを用いた。

[matplotlib 3D] 35. 円柱(円筒座標)
matplotlib mplot3dで円柱(シリンダー)を3次元表示する方法を解説します。円筒座標系を使ってデータを生成し、3Dグラフ上に表現する手順と実装方法を紹介します。
sabopy.com
2018.11.26
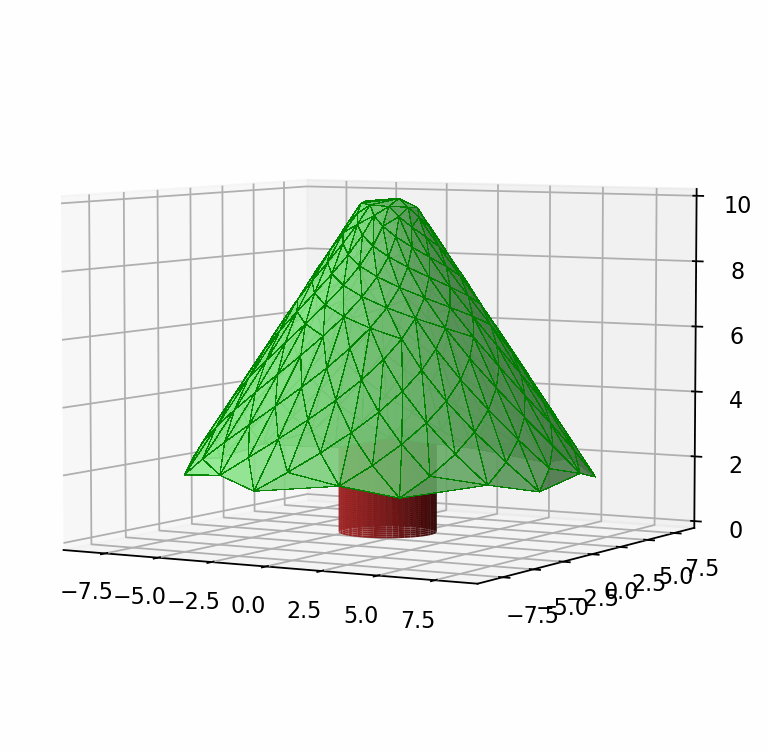
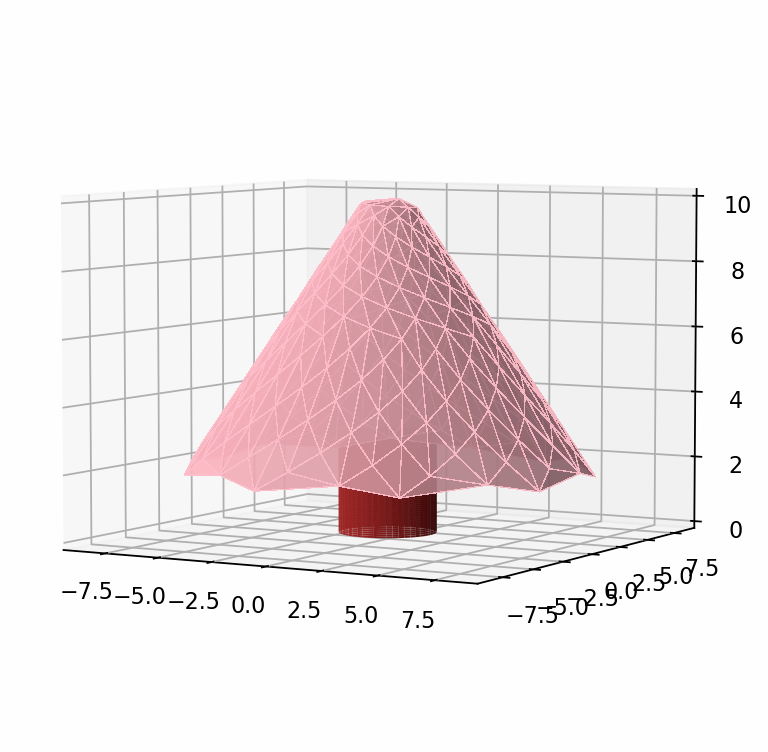
木の表示
3Dグラフとするためにax = fig.add_subplot(projection=’3d’)とする。
plot_trisurfで木の葉っぱの部分を表示して、plot_surfaceで幹を表示する。
ax.view_init(elev=5)で下の方から見上げる視点とする。
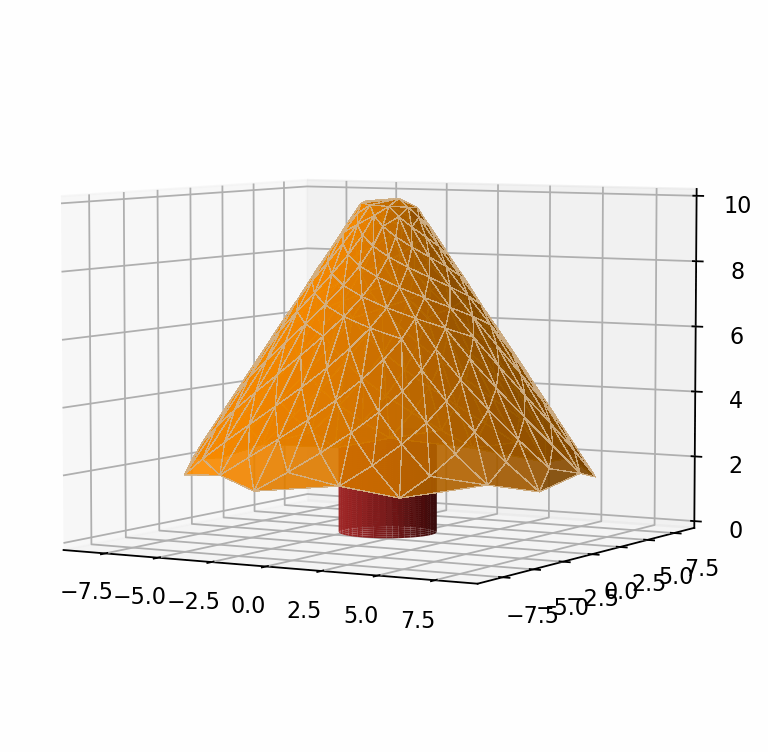
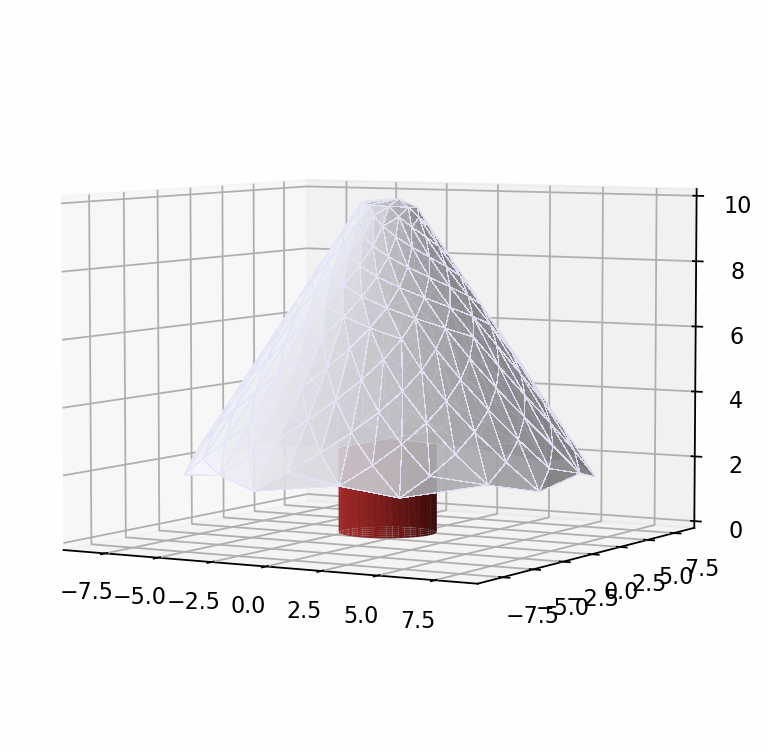
葉っぱの色を変えた場合
秋バージョン
冬バージョン
春バージョン
参考

NIKKEI STYLEは次のステージに
NIKKEI STYLEが生まれ変わりました。キャリア、転職、人材育成のヒントを提供してきた「リスキリング」チャンネルは新生「NIKKEIリスキリング」に。ビジネスパーソンのためのファッション情報を集めた「Men’s Fashion」チャン...
style.nikkei.com

mpl_toolkits.mplot3d.axes3d.Axes3D — Matplotlib 3.5.0 documentation
matplotlib.org

コメント