はじめに
このノートでは、matplotlibライブラリを使用して、グラフの軸先端を矢印形状にする方法を解説します。mpl_toolkits.axisartistモジュールを活用した実装方法について、サンプルコードと具体例を交えながら説明していきます。数学や物理学の図表作成に役立つテクニックです。
コード
解説
モジュールのインポート
figの作成
グラフを作成するには、SubplotZero(fig, 111)のように、SubplotZeroを使用する必要があります。SubplotZeroはmatplotlib.axes._subplots.AxesZeroSubplotのクラスです。
軸の設定
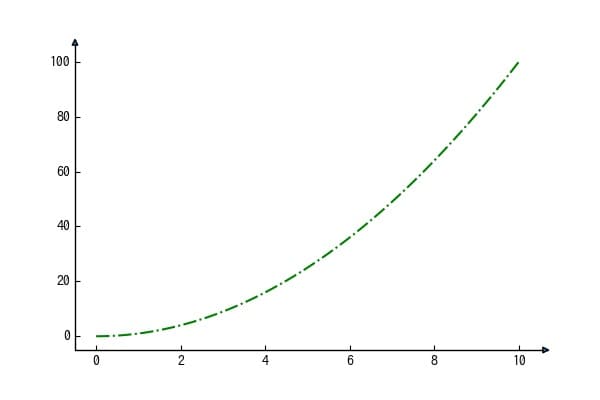
上と右の軸をset_visible(False)で非表示にします。下と左の軸に.set_axisline_style(“-|>”)を適用して軸の先端を矢印にします。
矢印のスタイルを変える
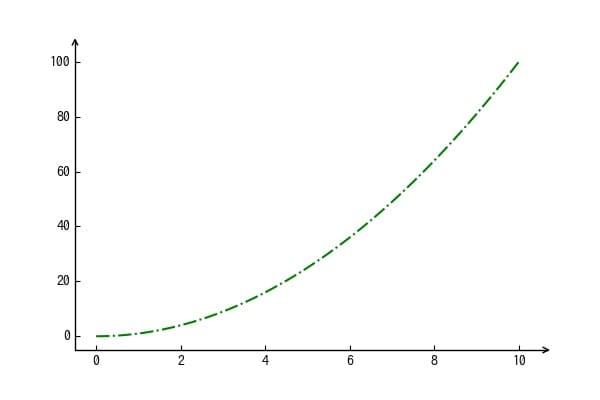
set_axisline_style(“->”)とすることで塗りつぶし矢印ではなく、普通の矢印となります。
先端の大きさを変える
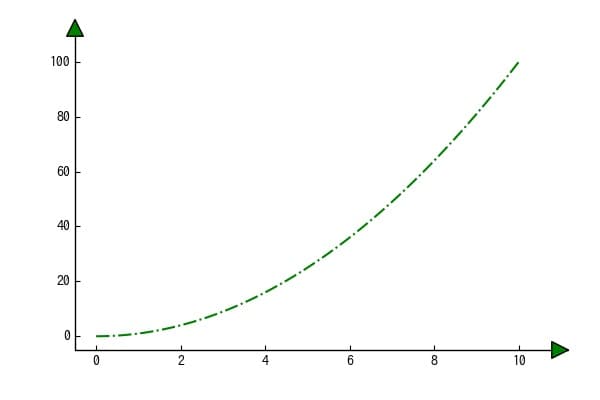
set_axisline_style(“-|>”, size=3)で矢印のサイズを変更できます。また、line.set_facecolor(“g”)で塗りつぶし矢印の色を変えられます。
軸、目盛り、目盛りラベルの色を変える
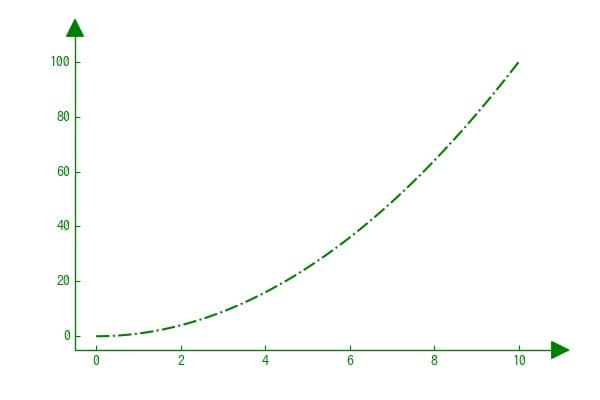
上記のようにすることで矢印、軸、目盛り、目盛りラベルの色を変えることができます。
コードをダウンロード(.pyファイル) コードをダウンロード(.ipynbファイル)参考

Axis line styles — Matplotlib 3.10.8 documentation
matplotlib.org

Attention Required! | Cloudflare
stackoverflow.com
Attention Required! | Cloudflare
stackoverflow.com

コメント