はじめに
この記事では、matplotlibとFuncAnimationを使って、ランダムな位置に絵文字が出現し、拡大しながら徐々に消えていくアニメーションの作成方法を解説しています。Pythonプログラミングで視覚的に楽しいエフェクトを実装する具体例を提供します。
下記記事の雨のアニメーションを参考にして作成しました。


コード
解説
モジュールのインポートなど
バージョン
データの作成
NumPyの構造化配列を使用します。配列の要素をPandasのDataFrameのように変更できるのが特徴です。
np.random.uniform(10, 20, n_drops)関数で10〜20の範囲の値をもつn_drops個の要素からなる配列を生成します。 一方、np.random.rand(n_drops)*20は0〜20の範囲の値をもつn_drops個の要素からなる配列を生成します。
初期データで図を表示
図中への絵文字の表示は下記記事と同様にannotateで行います。
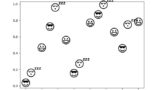
絵文字は文字列として扱われるため、fontsizeパラメータでそのサイズを変更できます。以下に図示します。
アニメーション関数の設定
current_index = frame_number % n_dropsで次にリセットするインデックスを決定します。
emoji_drops[‘alpha’] -= 1.0/len(emoji_drops)でアルファ値(透明度)を徐々に下げていき、np.clip(emoji_drops[‘alpha’], 0, 1)で値を0から1の範囲に制限します。
emoji_drops[‘size’] += emoji_drops[‘growth’]で絵文字のサイズを徐々に拡大していきます。
78-81行目のコードでcurrent_indexの絵文字データをリセットしています。
ax.cla()で現在表示されている図を消去し、すべてのデータを再度annotateで描画することでアニメーション効果を実現します。
アニメーションの表示
FuncAnimationを使用してアニメーションを表示します。フレーム数はデフォルトで100であり、intervalを50msに設定した場合、アニメーションの長さは5秒になります。
HTML(ani.to_html5_video())を実行することで、Jupyter NotebookまたはJupyter Lab上にアニメーションを直接表示できます。
また、ani.save(‘ファイル名’, writer=”ffmpeg”, dpi=100)を使用すると、アニメーションをMP4形式で保存できます。
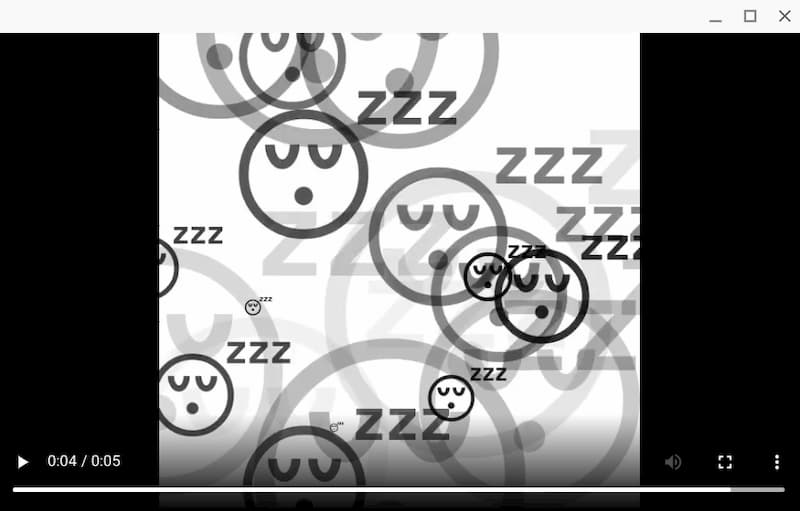
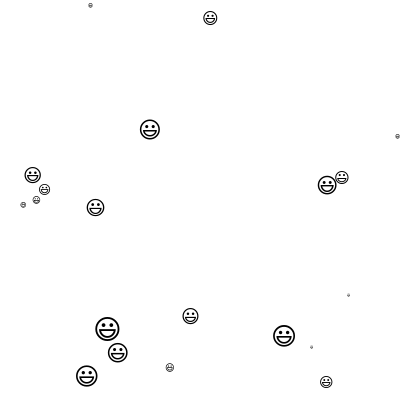
マーカーを😎とした場合
マーカーを😴とした場合
まとめ
matplotlibとFuncAnimationを活用することで、ランダムな位置に絵文字が出現し拡大・消滅するような動的なビジュアル表現が可能です。このような技術は、データ可視化だけでなく、インタラクティブなプレゼンテーションや教育コンテンツの作成にも応用できます。Pythonのグラフィック機能を使いこなすことで、プログラミングの楽しさを再発見できるでしょう。
参考


コメント