はじめに
この記事では、ヒステリシスしきい値処理を用いたエッジ検出手法について解説します。scikit-imageライブラリのapply_hysteresis_threshold関数を活用することで、ノイズに強く、連続性のあるエッジ検出が可能になります。従来のシンプルなしきい値処理と比較して、より高品質なエッジ検出結果が得られる手法を紹介していきます。
コード
解説
モジュールのインポート
画像データの読み込み
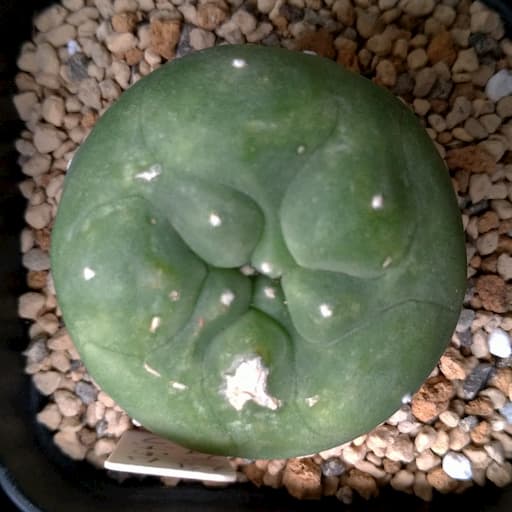
下のロフォフォラの画像を読み込み、rgb2grayにより、グレースケール化します。
Sobel法によるエッジの検出
Sobel法によるエッジの検出の詳細は下記で解説しました。
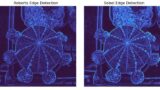
[scikit-image] 16. エッジ演算子(filters.roberts, sobel)
scikit-imageのfiltersモジュールに含まれるrobertsフィルタとsobelフィルタを使った画像エッジ検出の方法を解説。両フィルタの特性や使い方について、サンプルコードと実行結果を交えて詳しく紹介しています。
sabopy.com
2019.05.10
しきい値処理
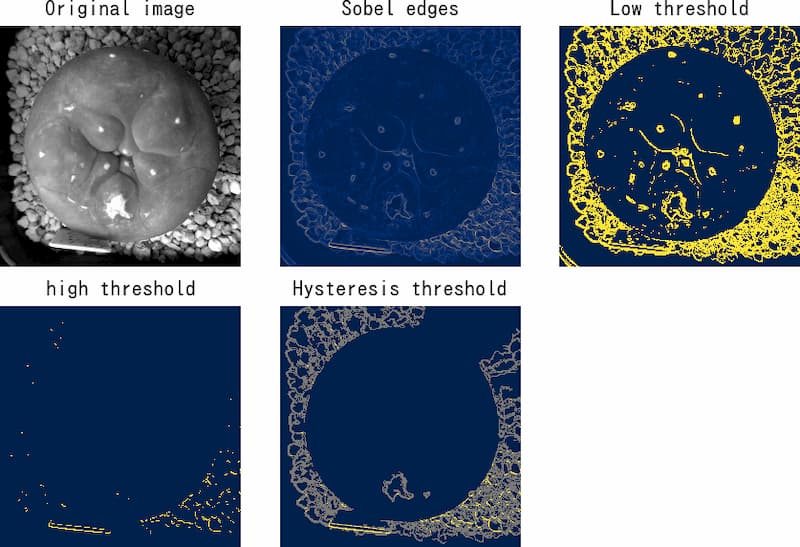
sobelで検出したedgeをヒストグラムとすると、下記のようになります。

「lowt」と「hight」はそれぞれ0.05以上、0.25以上で2値化した画像です。astype(int)によってブール値を0か1に変換しています。
「hyst」はfilters.apply_hysteresis_threshold(edges, low, high)によるヒステリシスしきい値処理画像です。この処理では、低いしきい値(0.05)を超える領域が、高いしきい値(0.25)を超える領域に隣接している場合のみ、有効なエッジとして認識されます。
その結果、ロフォフォラの棘座(緑色の物体に点在する白い点)は「lowt」では検出されているものの、「hyst」では除去されていることが確認できます。
画像の表示
Imagegridにより、cmapを’cividis’で表示した。
[matplotlib] 19. mpl_toolkits.axes_grid1 の使い方(画像の表示)
Matplotlib の拡張モジュール mpl_toolkits.axes_grid1 を使って複数画像を効率的に表示する方法を解説。ImageGrid による整然としたレイアウト、スケールバー・カラーバーの追加など、科学計算や画像処理に役立つ可視化テクニックを紹介しています。
sabopy.com
2019.03.04
参考

Hysteresis thresholding — skimage 0.26.0 documentation
scikit-image.org

skimage.filters — skimage 0.26.1rc0.dev0 documentation
scikit-image.org

skimage.filters — skimage 0.26.1rc0.dev0 documentation
scikit-image.org
コメント