はじめに
scikit-imageは画像処理を行うPythonのライブラリです。本記事では、scikit-imageのskimage.future.graphモジュールにあるshow_rag関数を使って、領域隣接グラフ(Region Adjacency Graph: RAG)の表示方法を解説します。RAGは画像をセグメンテーション(領域分割)した後、隣接する領域間の関係を表現するグラフ構造です。このRAGを視覚化することで、画像の分割結果や領域間の関係性を直感的に理解できます。これは画像処理やコンピュータービジョンの分野で、高度な画像解析やセグメンテーション改善に役立つ重要なツールとなります。
コード

解説
モジュールのインポート
画像データの読み込み
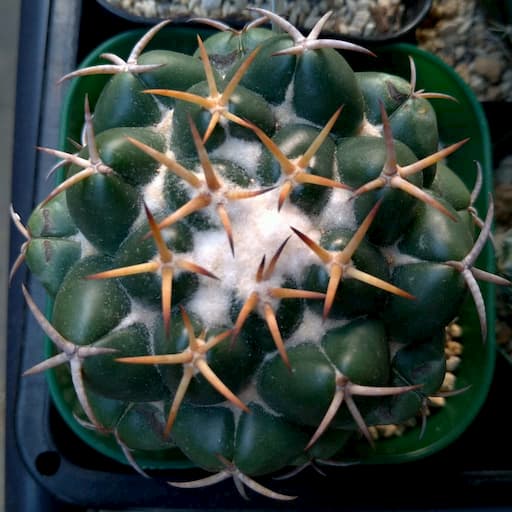
コリファンタ属の象牙丸を用います。
k平均法によるセグメント化
segmentation.slic()により、k平均法によるセグメント化を行います。
隣接境界グラフの生成
rag_mean_color()で画像とそのセグメント化された情報から、領域隣接グラフ(RAG)を構築します。
領域隣接グラフを表示
Imagegridの設定
Imagegridを用いて画像を表示します。Imagegridについては下記で解説しました。
[matplotlib] 19. mpl_toolkits.axes_grid1 の使い方(画像の表示)
Matplotlib の拡張モジュール mpl_toolkits.axes_grid1 を使って複数画像を効率的に表示する方法を解説。ImageGrid による整然としたレイアウト、スケールバー・カラーバーの追加など、科学計算や画像処理に役立つ可視化テクニックを紹介しています。
sabopy.com
2019.03.04
[matplotlib] 20. mpl_toolkits.axes_grid1 の使い方(ラベルとカラーバー)
matplotlib の mpl_toolkits.axes_grid1 モジュールを使った複数画像の表示方法、特にラベルやカラーバーの配置と設定について解説するチュートリアル。複数サブプロットの効率的な管理方法と視覚的に美しいグラフ作成のテクニックを紹介。
sabopy.com
2019.03.05
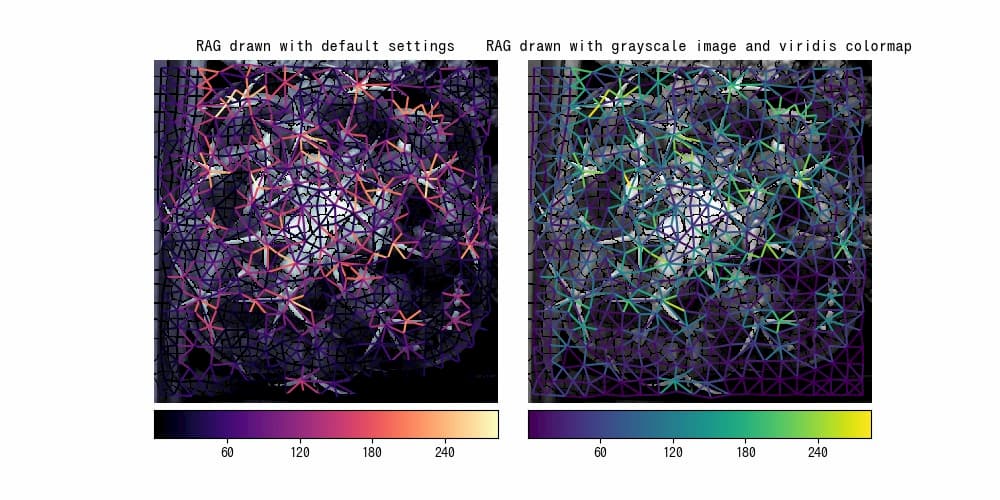
default settingsの画像
imgとRAGが同じような色調で表示されます。
画像とRAGのcmapを変えた画像
グレースケール画像にviridisのRAGを表示しました。
コードをダウンロードまとめ
scikit-imageのshow_rag関数を用いることで、画像のセグメンテーション結果を領域隣接グラフとして視覚化できることを学んだ。RAGは領域間の関係性を表現するため、画像分析において有用なツールである。この機能を活用することで、複雑な画像セグメンテーションの結果をより理解しやすく表現することが可能となる。
参考

Drawing Region Adjacency Graphs (RAGs) — skimage 0.26.0 documentation
scikit-image.org

skimage.segmentation — skimage 0.26.0 documentation
scikit-image.org

Page not found · GitHub Pages
scikit-image.org

Page not found · GitHub Pages
scikit-image.org
コメント