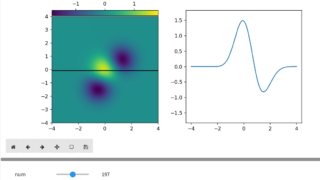
python [scikit-image] 37. 画像の欠損部分を修復(skimage.restoration inpaint) ここでは、skimage restoration inpaintにより画像の欠損部分を修復する例について説明する。 2019.07.27 python画像処理
python [scikit-image] 36. アンシャープマスク処理による画像の鮮明化(skimage.filters unsharp_mask) ここでは、skimage filters unsharp_maskにより画像を鮮明化する例について説明する。 2019.07.27 python画像処理
matplotlib Animation [matplotlib animation] 50. rank.mean_bilateralを用いた平均化する領域が変化していくアニメーション ここではskimage.rank.mean_bilateralのs0, s1が変化するアニメーションについて解説する。 2019.07.26 matplotlib Animationpython画像処理
python [scikit-image] 35. 平均化フィルタによる画像の平滑化(skimage.rank mean, mean_percentile, mean_percentile) ここでは、skimage rank mean, mean_percentile, mean_percentileにより画像に平均化フィルタを適用した例について説明する。 2019.07.26 python画像処理
ipywidgets [ipywidgets] 1. interactによる画像の2値化 jupyter notebookでは対話的にパラメータを調整できる機能(ipywidgets)がある。ここでは、その機能の一つであるinteractにより、ヒストグラム上でしきい値を動かし、2値化像を変化させる方法について説明する。 2019.07.24 ipywidgetsjupyter notebook, labmatplotlibpython画像処理
matplotlib [matplotlib] 38. widgets.Sliderによる画像の2値化 matplotlibではインタラクティブにパラメータを調整できる機能がある。ここでは、その機能の一つであるwidgets.Sliderにより、ヒストグラム上でしきい値を動かし、2値化像を変化させる方法について説明する。 2019.07.23 matplotlibpython画像処理
matplotlib [matplotlib] 37. widgets.Sliderによる円の半径と位置の調整 matplotlibではインタラクティブにパラメータを調整できる機能がある。ここでは、その機能の一つであるwidgets.Sliderにより、円の径と位置を調整できるグラフを出力する方法について説明する。 2019.07.21 matplotlibpython
matplotlib [matplotlib] 36. グラフ背景に縞模様を表示してデータの視認性を向上させる方法 matplotlibを使用してグラフ背景にgridに沿った縞模様を表示する方法を解説。軸に沿った背景色分けでデータの視認性を向上させる技術を紹介しています。 2019.07.19 matplotlibpython