はじめに
この記事では、matplotlibライブラリのhatch機能を使って、グラフや図表に様々な模様を適用する方法を解説しています。特にax.fill_between関数を用いた塗りつぶし領域への模様の適用方法と、利用可能な全パターンの一覧を紹介しています。また、模様の太さや密度を調整するテクニックについても説明しており、データの視覚的区別が必要な場合に役立つ情報を提供しています。
コード&解説
モジュールのインポートなど
バージョン
データの作成
lmfit.lineshapes の gaussianでガウス分布データを作成します。
ax.fill_betweenで任意のhatchを用いる関数
aはaxで、 hはhatchで,fcはfill_betweenのfacecolorを示しています。
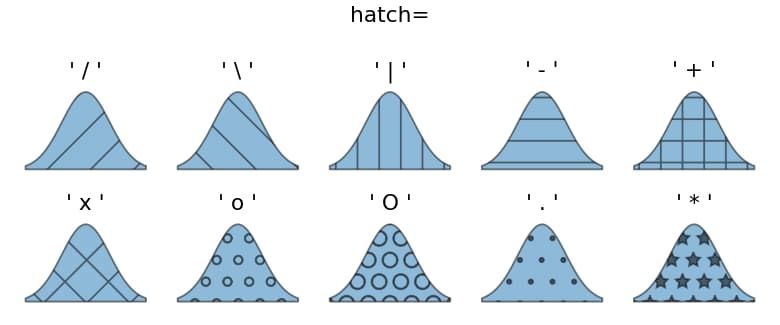
hatchを変化させて、ax.fill_betweenをplot その1
hatch を [‘/’, ‘\\’, ‘|’, ‘-‘, ‘+’, ‘x’, ‘o’, ‘O’, ‘.’, ‘*’]として、plotした場合には、以下のようになります。
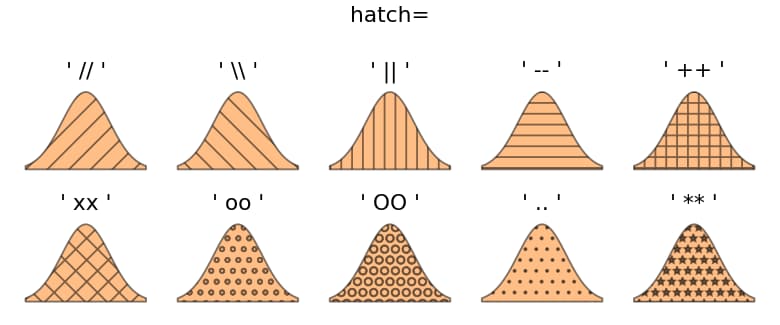
hatchを変化させて、ax.fill_betweenをplot その2
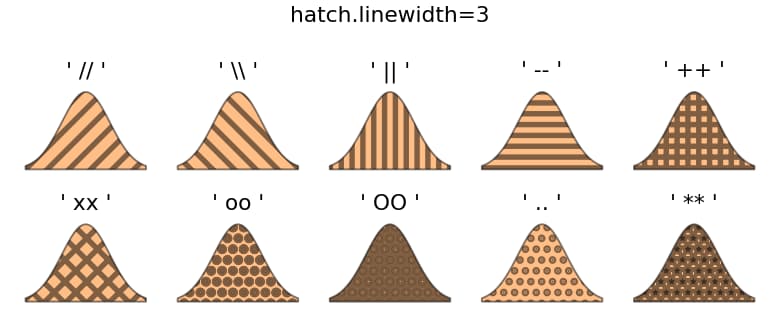
hatch を [‘//’, ‘\\\\’, ‘||’, ‘–‘, ‘++’, ‘xx’, ‘oo’, ‘OO’, ‘..’, ‘**’]として、plotした場合には、以下のようになります。
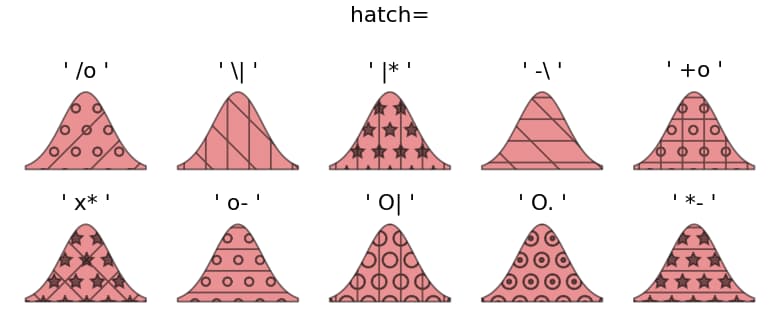
hatchを変化させて、ax.fill_betweenをplot その3
hatch を [‘/o’, ‘\\|’, ‘|*’, ‘-\\’, ‘+o’, ‘x*’, ‘o-‘, ‘O|’, ‘O.’, ‘*-‘]として、plotした場合には、以下のようになります。
まとめて表示
その1からその3をまとめて表示すると以下のようになります。

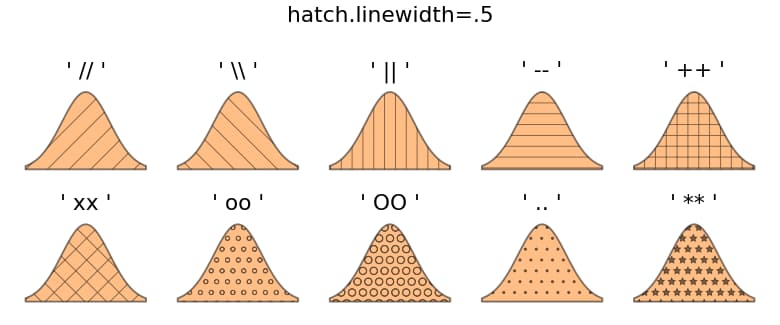
hatchの太さを細くする場合
plt.rcParams[“hatch.linewidth”]=.5として、hatch.linewidthを細くすると以下のようになります。
hatchの太さを太くする場合
plt.rcParams[“hatch.linewidth”]=3とすれば、太いhatchとなります。
参考

matplotlib.pyplot.fill_between — Matplotlib 3.10.8 documentation
matplotlib.org

Hatch style reference — Matplotlib 3.10.8 documentation
matplotlib.org

コメント