はじめに
この記事では、matplotlib のmplot3dモジュールを使用して作成する3Dグラフの面(pane)とその枠線の色を変更する方法について詳しく解説します。3Dプロットの視覚的な魅力を高め、データの見やすさを向上させるテクニックを紹介します。
コード

解説
モジュールのインポートなど
バージョン
データの生成
媒介変数的に球面のデータを作成します。
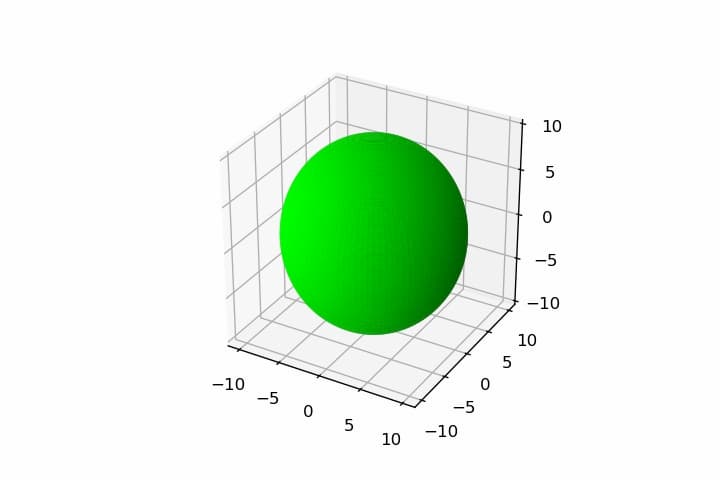
plot_surfaceによる球面の表示
plot_surfaceを使用すると下図のように表示されます。ax.set_box_aspect((1,1,1))でアスペクト比を1:1:1に設定しています。
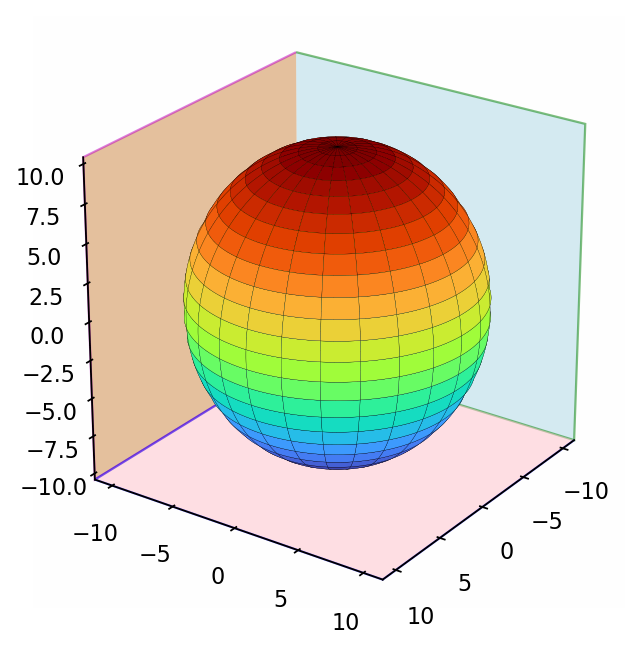
面の色を変えて表示
x軸側の面の色は ax.xaxis.pane.set_facecolor() で変更できます。y軸とz軸側は xaxis の部分をそれぞれ yaxis、zaxis に置き換えます。同様に、面の枠線(エッジ)の色は ax.xaxis.pane.set_edgecolor() などで変更できます。
軸目盛を非表示にする
各軸に対して、set_major_locator(ticker.NullLocator())を設定することで目盛りを非表示にし、軸の表示をカスタマイズできます。
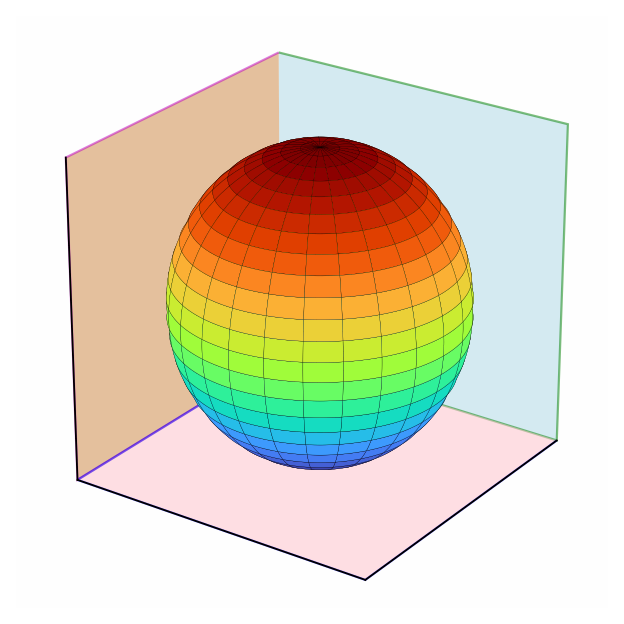
軸線を非表示にする
3Dプロットではspineの設定ができないため、ax.xaxis.line.set_color((1.0, 1.0, 1.0, 0.0))のように、RGBA形式で透明度を0に設定することで枠線を見えなくしています。
参考

mpl_toolkits.mplot3d.axes3d.Axes3D — Matplotlib 3.5.0 documentation
matplotlib.org

コメント