はじめに
matplotlibのmplot3dで3Dグラフ上に楕円体を表示する方法について説明します。
コード
解説
モジュールのインポート
バージョン
3Dグラフの設定
データの生成
楕円体を描画するには、球と同様に極座標的なパラメータ表示を使用します。角度パラメータθを0〜2π、φを0〜πの範囲で変化させると、楕円体を以下の式で表現できます。
$$x=acos\theta sin\phi\\y=bsin\theta sin\phi\\z=ccos\phi$$ここで a, b, c はそれぞれ x, y, z 軸方向の半径を表します。a = b = c の場合は球になります。球については以下で解説しています。
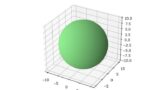
[matplotlib 3D] 18. 3D surfaceプロットで球を表示
matplotlibのmplot3dを使用して3Dグラフ上にsurface plotで球体を表示する方法を解説します。球の方程式からメッシュグリッドを作成し、3次元空間に美しく球体を描画する手順を紹介します。
sabopy.com
2018.10.17
軸範囲、軸ラベルの設定
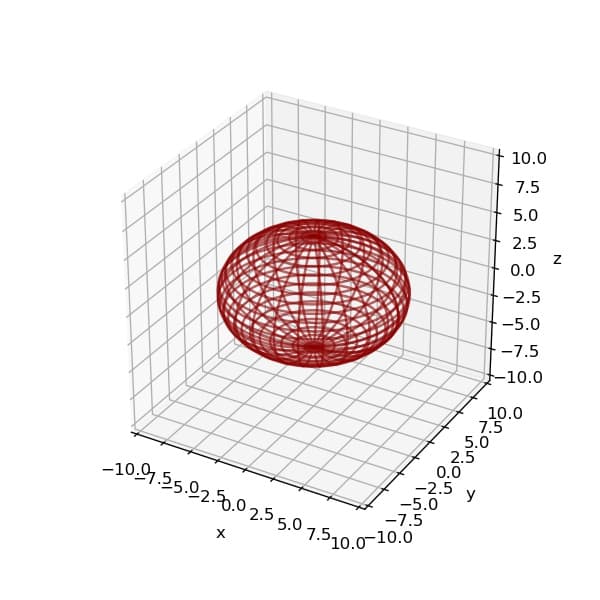
3D wireframe グラフでの表示
rcount、ccountはワイヤーフレームの本数を指定するパラメータで、例えばrcount=25とすると25本のワイヤーが描画されます。colorはワイヤーの色を指定します。
回転アニメーション
作製した図を回転させると以下のようになります。
回転アニメーションは以下の記事を参考にして作成しました。
[matplotlib 3D] 14. 3Dグラフの回転アニメーション
matplotlibのmplot3dを使用して3Dグラフの回転アニメーションを作成する方法を解説します。動画として保存する手順や回転角度の制御など、3Dビジュアライゼーションを動的に表現するための基本テクニックを紹介します。
sabopy.com
2018.10.25
参考

楕円体 - Wikipedia
ja.wikipedia.org

List of named colors — Matplotlib 3.10.8 documentation
matplotlib.org
コメント