はじめに
この記事では、matplotlibで図のマーカーとして絵文字(emoji)を使用する方法について解説します。annotate関数を活用することで、通常のマーカーの代わりに絵文字を配置し、データポイントをより視覚的に表現できます。具体的な方法は下記記事の画像をマーカーとして用いる方法と同じとなっています。
[matplotlib] 3. 画像マーカープロットを使った効果的なデータ可視化
matplotlibを使用して画像をマーカーとしてプロットする方法を解説。通常のデータ可視化に画像アイコンを取り入れることで、より視覚的にインパクトのあるグラフを作成。地図上の位置表示や気象データなど実用例も紹介。
sabopy.com
2018.11.06
コード
解説
モジュールのインポート
バージョン
マーカーの設定
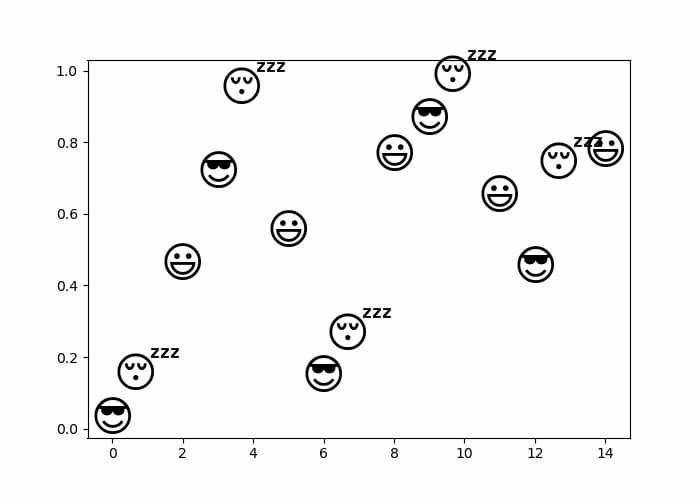
マーカーとして’😎’ と ‘😴’ と ‘😃’を用います。
データの生成と図の表示
ax.plot(x, y, alpha=0)で透明な(見えない)プロットを表示します。これを設定しておかないと、グラフの自動スケール調整が正しく機能しません。
emojiの表示
ax.annotateを使用して絵文字をデータポイントと同じ位置に表示します。周期的にマーカーをプロットするため、元データのxとyをスライスしてから絵文字をannotateしています。
itertoolsを用いたやり方
itertools.cycle((‘😎’, ‘😴’, ‘😃’))のようにmarkerを定義し、annotateでnext(marker)を使用することで、絵文字が周期的に切り替わるマーカーとして表示されます。

まとめ
matplotlibでemoji(絵文字)をマーカーとして使用することで、データ可視化をより直感的で魅力的なものにできます。annotate関数を使うことで実装は比較的簡単で、通常のマーカーよりも情報量の多い表現が可能になります。この手法はプレゼンテーションやデータストーリーテリングに効果的なアプローチとなるでしょう。
参考

https://matplotlib.org/users/dflt_style_changes.html#fonts
matplotlib.org

Forbidden - Stack Exchange
stackoverflow.com

コメント